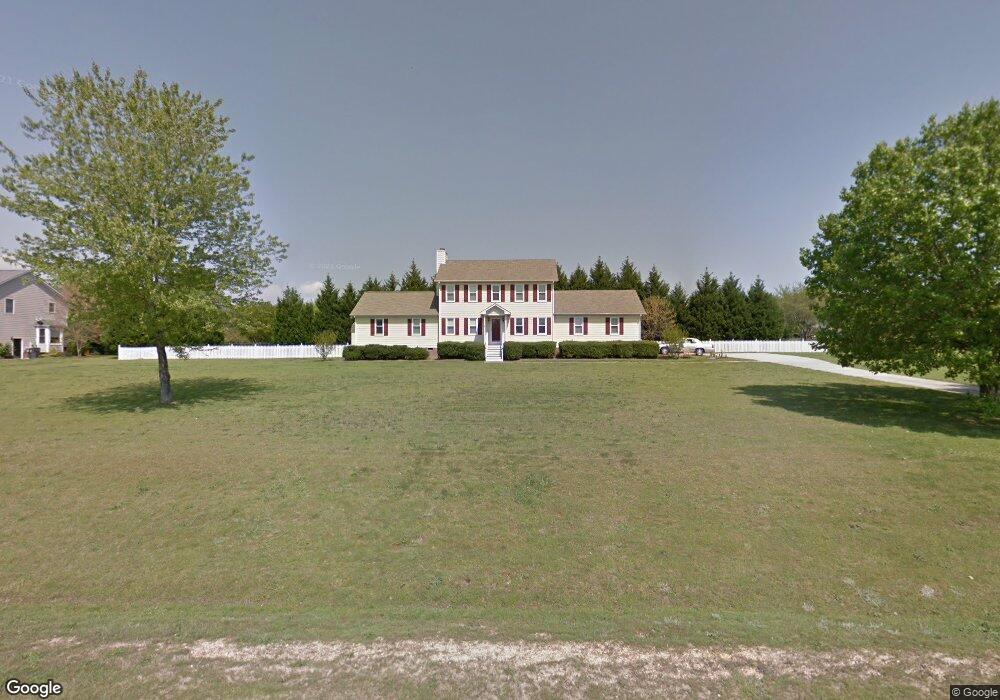
108 Pebble Dr Clayton, NC 27520
Estimated Value: $390,000 - $421,000
3
Beds
4
Baths
2,193
Sq Ft
$185/Sq Ft
Est. Value
About This Home
This home is located at 108 Pebble Dr, Clayton, NC 27520 and is currently estimated at $406,247, approximately $185 per square foot. 108 Pebble Dr is a home located in Johnston County with nearby schools including Cooper Academy, Riverwood Middle School, and Clayton High.
Ownership History
Date
Name
Owned For
Owner Type
Purchase Details
Closed on
Sep 25, 2018
Sold by
Prestige Home Solutions Llc
Bought by
Lyman Michael and Lyman Hilda
Current Estimated Value
Home Financials for this Owner
Home Financials are based on the most recent Mortgage that was taken out on this home.
Original Mortgage
$282,300
Outstanding Balance
$248,094
Interest Rate
4.87%
Mortgage Type
Adjustable Rate Mortgage/ARM
Estimated Equity
$158,153
Purchase Details
Closed on
May 2, 2018
Sold by
Hines Betty Barwick and Hines Gary
Bought by
Prestige Home Solutions Llc
Purchase Details
Closed on
May 25, 2005
Sold by
Anderson Thomas
Bought by
Barwick Betty Groff
Purchase Details
Closed on
Feb 2, 2004
Sold by
Anderson Thomas
Bought by
Sec Of Housing & Urban Dev
Purchase Details
Closed on
Dec 1, 2003
Sold by
Sec Of Housing & Urban Dev
Bought by
Shafer Jihad J
Create a Home Valuation Report for This Property
The Home Valuation Report is an in-depth analysis detailing your home's value as well as a comparison with similar homes in the area
Home Values in the Area
Average Home Value in this Area
Purchase History
| Date | Buyer | Sale Price | Title Company |
|---|---|---|---|
| Lyman Michael | $282,500 | None Available | |
| Prestige Home Solutions Llc | $162,500 | None Available | |
| Barwick Betty Groff | $145,000 | None Available | |
| Sec Of Housing & Urban Dev | -- | -- | |
| Shafer Jihad J | -- | -- |
Source: Public Records
Mortgage History
| Date | Status | Borrower | Loan Amount |
|---|---|---|---|
| Open | Lyman Michael | $282,300 |
Source: Public Records
Tax History
| Year | Tax Paid | Tax Assessment Tax Assessment Total Assessment is a certain percentage of the fair market value that is determined by local assessors to be the total taxable value of land and additions on the property. | Land | Improvement |
|---|---|---|---|---|
| 2025 | $2,252 | $354,620 | $75,000 | $279,620 |
| 2024 | $1,939 | $239,400 | $50,000 | $189,400 |
| 2023 | $2,011 | $239,400 | $50,000 | $189,400 |
| 2022 | $2,029 | $239,400 | $50,000 | $189,400 |
| 2021 | $2,029 | $239,400 | $50,000 | $189,400 |
| 2020 | $2,101 | $239,400 | $50,000 | $189,400 |
| 2019 | $2,101 | $239,400 | $50,000 | $189,400 |
| 2018 | $0 | $191,650 | $41,000 | $150,650 |
| 2017 | $1,720 | $191,650 | $41,000 | $150,650 |
| 2016 | $1,682 | $191,650 | $41,000 | $150,650 |
| 2014 | -- | $191,650 | $41,000 | $150,650 |
Source: Public Records
Map
Nearby Homes
- 55 Pink Iris Ct
- 151 Marywood Dr
- 25 Cloudberry Ct
- 135 Railcar Way
- 141 Railcar Way
- 80 Ballast Point
- 134 Channel Drop Dr
- 152 Channel Drop Dr
- 54 Wildflower Cir
- 11 Wildflower Cir
- 389 Channel Drop Dr
- 458 Channel Drop Dr
- 418 Ballast Point
- 20 Nicklaus Way
- 183 E Piston Point
- 5305 Oliver Ct
- TBD Channel Drop Dr Unit 94
- TBD Channel Drop Dr Unit 123
- 355 Streamliner Blvd
- 53 Lavender Ln
Your Personal Tour Guide
Ask me questions while you tour the home.