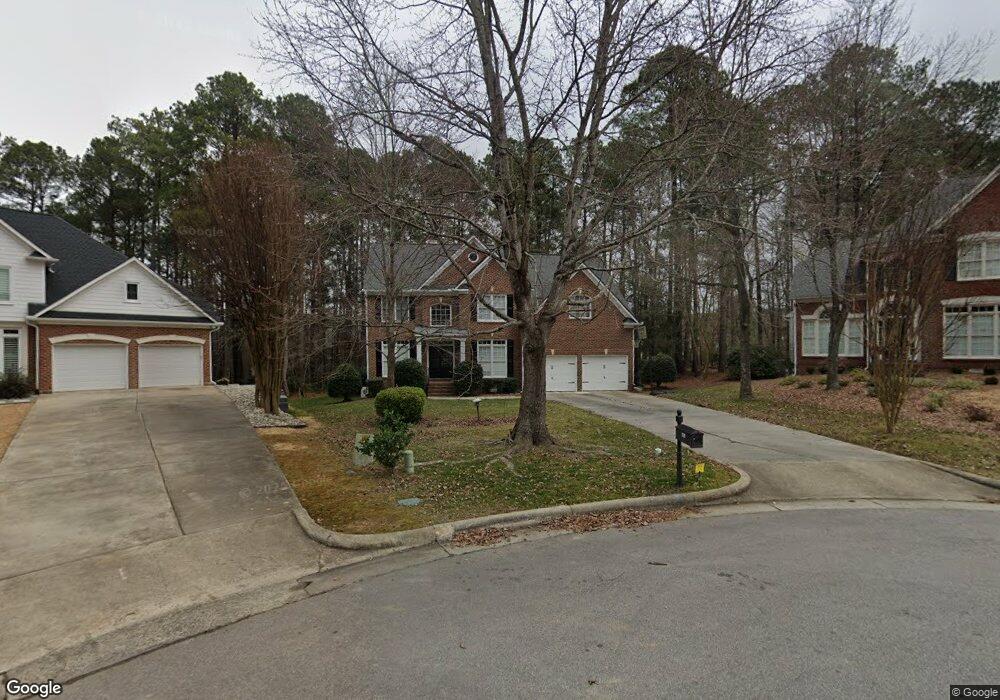
108 Peckskill Ct Cary, NC 27519
Preston NeighborhoodEstimated Value: $943,000 - $1,227,000
5
Beds
3
Baths
2,950
Sq Ft
$373/Sq Ft
Est. Value
About This Home
This home is located at 108 Peckskill Ct, Cary, NC 27519 and is currently estimated at $1,100,598, approximately $373 per square foot. 108 Peckskill Ct is a home located in Wake County with nearby schools including Green Hope Elementary, Davis Drive Middle, and Green Hope High.
Ownership History
Date
Name
Owned For
Owner Type
Purchase Details
Closed on
Feb 29, 2008
Sold by
Fried Philip L and Fried Maria A
Bought by
Fried Philip L and Fried Maria A
Current Estimated Value
Home Financials for this Owner
Home Financials are based on the most recent Mortgage that was taken out on this home.
Original Mortgage
$344,000
Interest Rate
5.2%
Mortgage Type
New Conventional
Purchase Details
Closed on
Jul 17, 2006
Sold by
Sirva Relocation Credit Llc
Bought by
Fried Philip A and Fried Maria A
Home Financials for this Owner
Home Financials are based on the most recent Mortgage that was taken out on this home.
Original Mortgage
$300,000
Interest Rate
6.18%
Mortgage Type
Purchase Money Mortgage
Purchase Details
Closed on
Apr 21, 2006
Sold by
Titkemeyer Robert W and Greer Kathleen Joan
Bought by
Sirva Relocation Credit Llc
Create a Home Valuation Report for This Property
The Home Valuation Report is an in-depth analysis detailing your home's value as well as a comparison with similar homes in the area
Home Values in the Area
Average Home Value in this Area
Purchase History
| Date | Buyer | Sale Price | Title Company |
|---|---|---|---|
| Fried Philip L | -- | None Available | |
| Fried Philip A | $487,500 | None Available | |
| Sirva Relocation Credit Llc | $487,500 | None Available |
Source: Public Records
Mortgage History
| Date | Status | Borrower | Loan Amount |
|---|---|---|---|
| Closed | Fried Philip L | $344,000 | |
| Closed | Fried Philip A | $300,000 |
Source: Public Records
Tax History
| Year | Tax Paid | Tax Assessment Tax Assessment Total Assessment is a certain percentage of the fair market value that is determined by local assessors to be the total taxable value of land and additions on the property. | Land | Improvement |
|---|---|---|---|---|
| 2025 | $8,292 | $965,121 | $325,000 | $640,121 |
| 2024 | $8,113 | $965,121 | $325,000 | $640,121 |
| 2023 | $6,698 | $666,505 | $183,000 | $483,505 |
| 2022 | $6,448 | $666,505 | $183,000 | $483,505 |
| 2021 | $6,318 | $666,505 | $183,000 | $483,505 |
| 2020 | $6,387 | $670,243 | $183,000 | $487,243 |
| 2019 | $6,077 | $565,686 | $168,000 | $397,686 |
| 2018 | $5,702 | $565,686 | $168,000 | $397,686 |
| 2017 | $5,165 | $533,194 | $168,000 | $365,194 |
| 2016 | $5,088 | $533,194 | $168,000 | $365,194 |
| 2015 | $4,980 | $503,858 | $152,000 | $351,858 |
| 2014 | $4,696 | $491,713 | $152,000 | $339,713 |
Source: Public Records
Map
Nearby Homes
- 101 Bartica Ct
- 1058 Kingston Grove Dr
- 107 Badin Lake Ct
- 201 Beeston Ct
- 106 Circle On the Green
- 1102 Huntington Park Dr
- 104 Parmalee Ct
- 902 Huntington Park Dr
- 104 Gambardelli Ct
- 205 Great Lake Dr
- 202 Sarazen Meadow Way
- 111 Madison Grove Place
- 104 Ivy Tree Place
- 615 Carpenter Town Ln
- 602 Presidents Walk Ln
- 502 Ballad Creek Ct
- 318 Madison Grove Place
- 105 Rockport Ridge Way
- 813 Carpenter Town Ln
- 1600 Gathering Park Cir Unit 303
- 110 Peckskill Ct
- 106 Peckskill Ct
- 800 Walcott Way
- 802 Walcott Way
- 111 Peckskill Ct
- 716 Walcott Way
- 104 Peckskill Ct
- 804 Walcott Way
- 206 Ketrick Ct
- 209 Ketrick Ct
- 109 Peckskill Ct
- 714 Walcott Way
- 107 Peckskill Ct
- 900 Walcott Way
- 102 Peckskill Ct
- 204 Ketrick Ct
- 105 Peckskill Ct
- 207 Ketrick Ct
- 904 Walcott Way
- 801 Walcott Way
Your Personal Tour Guide
Ask me questions while you tour the home.