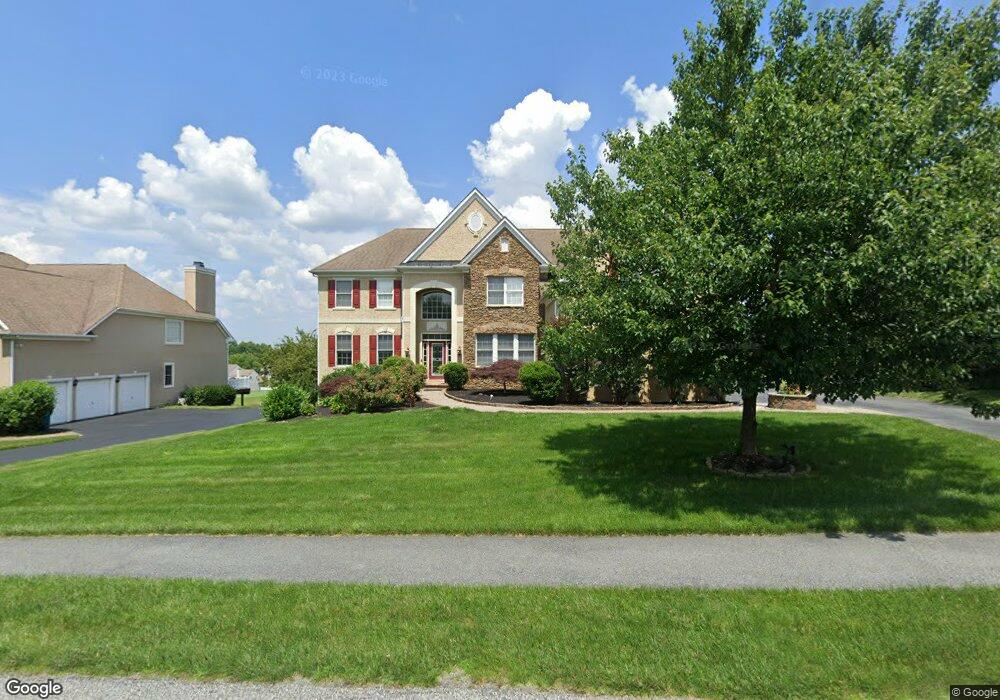
108 Portmarnock Dr Avondale, PA 19311
Estimated Value: $822,000 - $970,000
4
Beds
5
Baths
4,403
Sq Ft
$200/Sq Ft
Est. Value
About This Home
This home is located at 108 Portmarnock Dr, Avondale, PA 19311 and is currently estimated at $880,347, approximately $199 per square foot. 108 Portmarnock Dr is a home located in Chester County with nearby schools including Kennett Middle School, Kennett High School, and Sanford School.
Ownership History
Date
Name
Owned For
Owner Type
Purchase Details
Closed on
May 13, 2021
Sold by
Borkess Matthew
Bought by
Okeefe Kathleen
Current Estimated Value
Purchase Details
Closed on
Aug 27, 2008
Sold by
Villanueva Roderick A and Villanueva Maria T
Bought by
Okeefe Matthew and Okeefe Kathleen
Home Financials for this Owner
Home Financials are based on the most recent Mortgage that was taken out on this home.
Original Mortgage
$375,000
Interest Rate
6.69%
Mortgage Type
Purchase Money Mortgage
Purchase Details
Closed on
Oct 27, 2003
Sold by
Bhc Venture Inc
Bought by
Villanueva Roderick A and Villanueva Maria T
Home Financials for this Owner
Home Financials are based on the most recent Mortgage that was taken out on this home.
Original Mortgage
$454,000
Interest Rate
4%
Mortgage Type
Purchase Money Mortgage
Create a Home Valuation Report for This Property
The Home Valuation Report is an in-depth analysis detailing your home's value as well as a comparison with similar homes in the area
Home Values in the Area
Average Home Value in this Area
Purchase History
| Date | Buyer | Sale Price | Title Company |
|---|---|---|---|
| Okeefe Kathleen | -- | None Available | |
| Okeefe Matthew | $525,000 | None Available | |
| Villanueva Roderick A | $569,339 | -- |
Source: Public Records
Mortgage History
| Date | Status | Borrower | Loan Amount |
|---|---|---|---|
| Previous Owner | Okeefe Matthew | $375,000 | |
| Previous Owner | Villanueva Roderick A | $454,000 | |
| Closed | Villanueva Roderick A | $68,000 |
Source: Public Records
Tax History Compared to Growth
Tax History
| Year | Tax Paid | Tax Assessment Tax Assessment Total Assessment is a certain percentage of the fair market value that is determined by local assessors to be the total taxable value of land and additions on the property. | Land | Improvement |
|---|---|---|---|---|
| 2025 | $11,351 | $283,430 | $76,020 | $207,410 |
| 2024 | $11,351 | $283,430 | $76,020 | $207,410 |
| 2023 | $10,971 | $283,430 | $76,020 | $207,410 |
| 2022 | $10,811 | $283,430 | $76,020 | $207,410 |
| 2021 | $10,701 | $283,430 | $76,020 | $207,410 |
| 2020 | $10,498 | $283,430 | $76,020 | $207,410 |
| 2019 | $10,356 | $283,430 | $76,020 | $207,410 |
| 2018 | $10,008 | $283,430 | $76,020 | $207,410 |
| 2017 | $9,803 | $278,250 | $76,020 | $202,230 |
| 2016 | $1,103 | $278,250 | $76,020 | $202,230 |
| 2015 | $1,103 | $278,250 | $76,020 | $202,230 |
| 2014 | $1,103 | $278,250 | $76,020 | $202,230 |
Source: Public Records
Map
Nearby Homes
- 104 Kittanset Ct
- 109 Regency Ct
- 139 Sharp Rd
- 111 Saint Andrews Dr
- 400 Losito Dr
- 346 Carlisle Dr
- 104 Saint Andrews Dr
- 9129 Gap Newport Pike
- 535 Chandler Mill Rd
- 118 Pleasant Bank Ln
- 100 Declan Unit HAWTHORNE
- 100 Declan Unit NOTTINGHAM
- 100 Declan Unit MAGNOLIA
- 100 Declan Unit SAVANNAH
- 1003 Newark Rd
- 114 Chandler Mill Rd
- 117 Chandler Mill Rd
- 683 Mc Govern Rd
- 115 Chandler Mill Rd
- 603 Cabot Ct
- 110 Portmarnock Dr
- 106 Portmarnock Dr
- 112 Portmarnock Dr
- 104 Portmarnock Dr
- 101 Five Farms Cir
- 102 Five Farms Cir
- 102 Sandwich Ln
- 101 Portmarnock Dr
- 114 Portmarnock Dr
- 102 Portmarnock Dr
- 103 Five Farms Cir
- 104 Sandwich Ln
- 116 Portmarnock Dr
- 105 Five Farms Cir
- 106 Five Farms Cir
- 103 Muirfield Ct
- 105 Muirfield Ct
- 107 Muirfield Ct
- 101 Muirfield Ct
- 106 Sandwich Ln