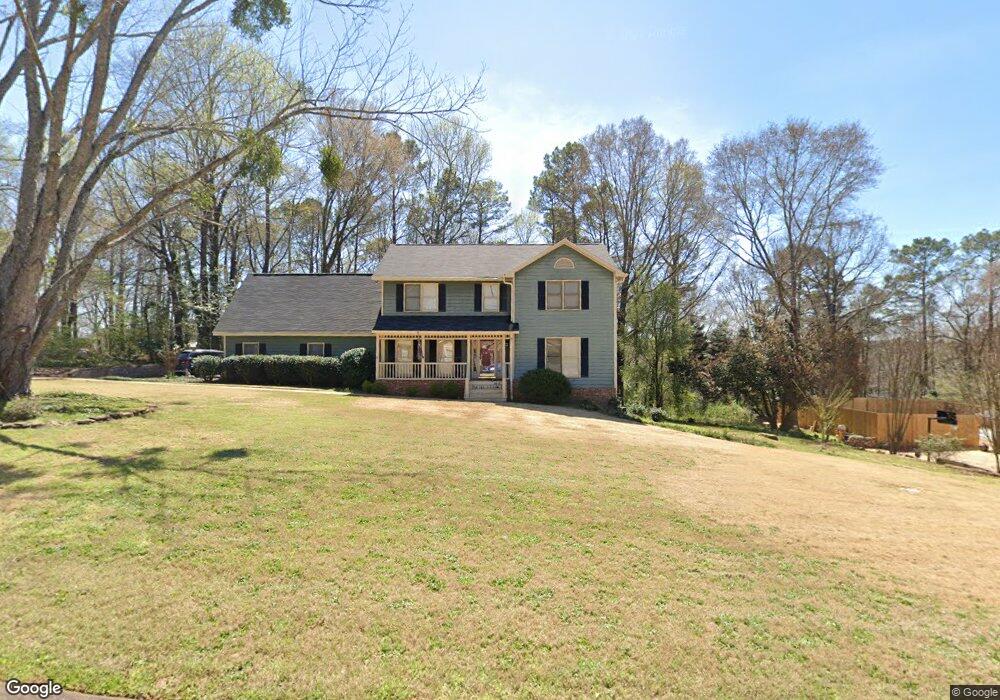
108 Powers Ct Lagrange, GA 30240
Estimated Value: $351,548 - $378,000
4
Beds
4
Baths
3,410
Sq Ft
$106/Sq Ft
Est. Value
About This Home
This home is located at 108 Powers Ct, Lagrange, GA 30240 and is currently estimated at $360,137, approximately $105 per square foot. 108 Powers Ct is a home located in Troup County with nearby schools including Franklin Forest Elementary School, Hollis Hand Elementary School, and Ethel W. Kight Elementary School.
Ownership History
Date
Name
Owned For
Owner Type
Purchase Details
Closed on
Jan 3, 2020
Sold by
Askew Cynthia M
Bought by
Flournoy Ticri
Current Estimated Value
Home Financials for this Owner
Home Financials are based on the most recent Mortgage that was taken out on this home.
Original Mortgage
$209,900
Outstanding Balance
$183,856
Interest Rate
3.6%
Mortgage Type
VA
Estimated Equity
$176,281
Purchase Details
Closed on
Jun 4, 1997
Sold by
Laurent Daniel J
Bought by
Emmett Askew J
Purchase Details
Closed on
Feb 24, 1993
Sold by
Laurent D
Bought by
Laurent Daniel J
Purchase Details
Closed on
Feb 12, 1993
Sold by
Pribyl
Bought by
Laurent D
Purchase Details
Closed on
Jan 5, 1990
Sold by
Donna Harman
Bought by
Pribyl
Purchase Details
Closed on
Oct 1, 1986
Sold by
Joseph L Harman
Bought by
Donna Harman
Purchase Details
Closed on
Oct 17, 1985
Bought by
Joseph L Harman
Purchase Details
Closed on
Feb 19, 1985
Sold by
Harry D Durand Trustee
Create a Home Valuation Report for This Property
The Home Valuation Report is an in-depth analysis detailing your home's value as well as a comparison with similar homes in the area
Purchase History
| Date | Buyer | Sale Price | Title Company |
|---|---|---|---|
| Flournoy Ticri | $209,900 | -- | |
| Emmett Askew J | $130,000 | -- | |
| Laurent Daniel J | -- | -- | |
| Laurent D | $133,000 | -- | |
| Pribyl | $139,000 | -- | |
| Donna Harman | -- | -- | |
| Joseph L Harman | $19,000 | -- | |
| Joseph L Harman | $19,000 | -- | |
| -- | -- | -- |
Source: Public Records
Mortgage History
| Date | Status | Borrower | Loan Amount |
|---|---|---|---|
| Open | Flournoy Ticri | $209,900 |
Source: Public Records
Tax History
| Year | Tax Paid | Tax Assessment Tax Assessment Total Assessment is a certain percentage of the fair market value that is determined by local assessors to be the total taxable value of land and additions on the property. | Land | Improvement |
|---|---|---|---|---|
| 2025 | $211 | $133,840 | $18,000 | $115,840 |
| 2024 | $2,827 | $107,600 | $18,000 | $89,600 |
| 2023 | $2,827 | $105,640 | $14,000 | $91,640 |
| 2022 | $2,703 | $98,840 | $14,000 | $84,840 |
| 2021 | $2,532 | $84,280 | $14,000 | $70,280 |
| 2020 | $2,482 | $84,280 | $14,000 | $70,280 |
| 2019 | $2,355 | $80,080 | $12,000 | $68,080 |
| 2018 | $2,265 | $77,080 | $9,600 | $67,480 |
| 2017 | $2,148 | $73,200 | $9,600 | $63,600 |
| 2016 | $2,147 | $73,161 | $9,600 | $63,561 |
| 2015 | $2,151 | $73,161 | $9,600 | $63,561 |
| 2014 | $2,053 | $69,816 | $9,600 | $60,216 |
| 2013 | -- | $74,728 | $9,600 | $65,128 |
Source: Public Records
Map
Nearby Homes
- 104 Englewood Dr
- 114 Red Oak Trail
- 1784 Mooty Bridge Rd
- 104 Sweetgum Dr
- 502 Ashford Cir
- 103 Windridge
- 91 Richmond Dr
- 102 Woodchase
- 107 Windridge
- 103 Woodchase
- 209 River Oaks Dr
- 109 Windridge
- 110 Pond View Point
- 204 Dixie Creek Dr
- 102 Beech Creek Dr
- 201 S Chilton Crescent
- 203 S Chilton Crescent
- 732 Camellia Dr
- 134 S Page St
- 724 Camellia Dr
- 110 Powers Ct
- 107 Kildare Ct
- 105 Powers Ct
- 109 Powers Ct Unit 30
- 109 Kildare Ct
- 104 Powers Ct
- 112 Powers Ct
- 105 Kildare Ct
- 103 Powers Ct Unit 27
- 103 Powers Ct
- 111 Powers Ct
- 103 Kildare Ct
- 111 Kildare Ct
- 108 Lismore Dr
- 126 Lismore Dr
- 124 Lismore Dr
- 128 Lismore Dr
- 113 Kildare Ct
- 104 Lismore Dr
- 108 Kildare Ct
Your Personal Tour Guide
Ask me questions while you tour the home.