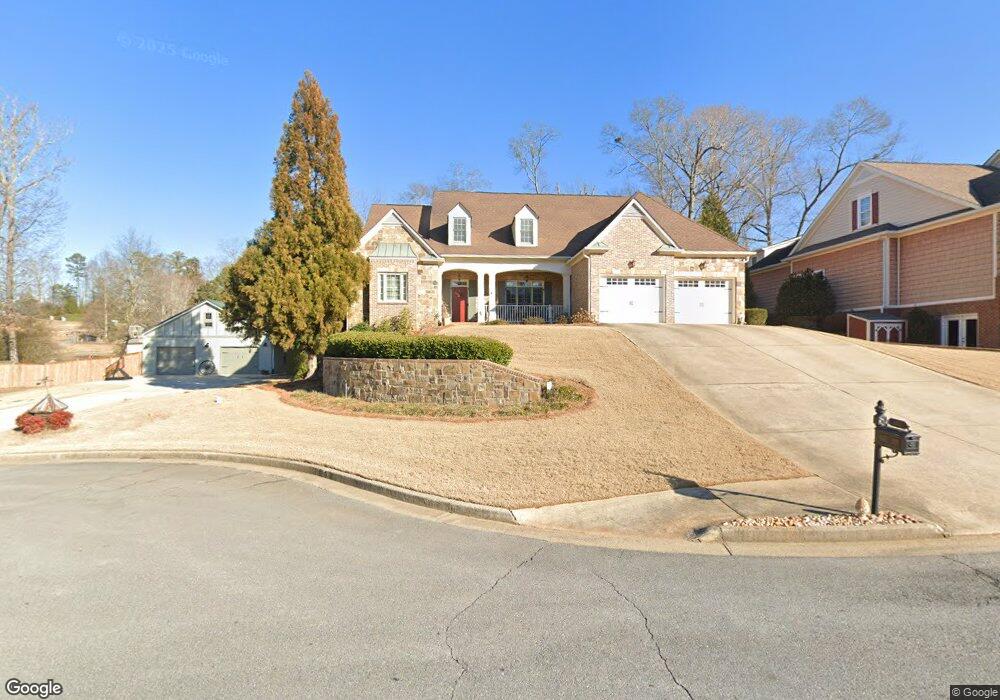
108 Ragsdale Place Dallas, GA 30132
Estimated Value: $575,000 - $705,000
4
Beds
4
Baths
3,149
Sq Ft
$206/Sq Ft
Est. Value
About This Home
This home is located at 108 Ragsdale Place, Dallas, GA 30132 and is currently estimated at $647,350, approximately $205 per square foot. 108 Ragsdale Place is a home located in Paulding County with nearby schools including Northside Elementary School, Herschel Jones Middle School, and Paulding County High School.
Ownership History
Date
Name
Owned For
Owner Type
Purchase Details
Closed on
Aug 6, 2012
Sold by
Wood Joetta Hunt
Bought by
Childes Nancy W
Current Estimated Value
Purchase Details
Closed on
Mar 31, 2006
Sold by
Stegall Jana
Bought by
Wood Joetta H
Home Financials for this Owner
Home Financials are based on the most recent Mortgage that was taken out on this home.
Original Mortgage
$360,000
Interest Rate
6.23%
Purchase Details
Closed on
Nov 4, 2005
Sold by
Miller Jeffery B and Miller Sandra
Bought by
Stegall Jana
Purchase Details
Closed on
Jan 14, 2004
Sold by
Butler Alie E
Bought by
Miller Jeffrey B and Miller Sandra
Purchase Details
Closed on
Mar 22, 2002
Sold by
Hardy Kenneth M
Bought by
Butler Alie E
Home Financials for this Owner
Home Financials are based on the most recent Mortgage that was taken out on this home.
Original Mortgage
$27,000
Interest Rate
6.77%
Mortgage Type
New Conventional
Create a Home Valuation Report for This Property
The Home Valuation Report is an in-depth analysis detailing your home's value as well as a comparison with similar homes in the area
Home Values in the Area
Average Home Value in this Area
Purchase History
| Date | Buyer | Sale Price | Title Company |
|---|---|---|---|
| Childes Nancy W | -- | -- | |
| Wood Joetta H | $100,000 | -- | |
| Stegall Jana | $82,000 | -- | |
| Miller Jeffrey B | $60,000 | -- | |
| Butler Alie E | $40,000 | -- |
Source: Public Records
Mortgage History
| Date | Status | Borrower | Loan Amount |
|---|---|---|---|
| Previous Owner | Wood Joetta H | $360,000 | |
| Previous Owner | Butler Alie E | $27,000 |
Source: Public Records
Tax History Compared to Growth
Tax History
| Year | Tax Paid | Tax Assessment Tax Assessment Total Assessment is a certain percentage of the fair market value that is determined by local assessors to be the total taxable value of land and additions on the property. | Land | Improvement |
|---|---|---|---|---|
| 2024 | $3,962 | $297,412 | $48,000 | $249,412 |
| 2023 | $3,175 | $258,224 | $32,000 | $226,224 |
| 2022 | $1,783 | $218,280 | $32,000 | $186,280 |
| 2021 | $1,895 | $187,808 | $32,000 | $155,808 |
| 2020 | $5,948 | $175,620 | $32,000 | $143,620 |
| 2019 | $5,892 | $171,788 | $32,000 | $139,788 |
| 2018 | $4,626 | $153,556 | $25,600 | $127,956 |
| 2017 | $4,969 | $143,128 | $25,600 | $117,528 |
| 2016 | $4,666 | $135,620 | $25,600 | $110,020 |
| 2015 | $4,006 | $130,148 | $25,600 | $104,548 |
| 2014 | $4,040 | $127,984 | $25,600 | $102,384 |
| 2013 | -- | $106,880 | $25,600 | $81,280 |
Source: Public Records
Map
Nearby Homes
- 200 Polk Ave
- 204 Polk Ave Unit 1
- 220 Confederate Ave
- 210 N Johnston St
- 0 Polk Ln Unit 25025134
- 207 Confederate Ave
- Spruce Plan at Meadow Pines - Bungalow Series
- Mulberry Plan at Meadow Pines - Bungalow Series
- Linden Plan at Meadow Pines - Bungalow Series
- Hawthorne Plan at Meadow Pines - Bungalow Series
- Aspen Plan at Meadow Pines - Bungalow Series
- 205 Hart Cir
- 67 Polk Ln
- 109 Westwood Dr
- 69 Walraven Place
- 219 Briarwood Dr
- 304 Oscar Way
- 119 Mcbee St
- 24 Polk Path
- 136 Rosewood Dr
- 106 Ragsdale Place
- 110 Ragsdale Place
- 104 Ragsdale Place
- 0 Ragsdale Place Unit 8039317
- 0 Ragsdale Place Unit 8253703
- 0 Ragsdale Place Unit 8126701
- 0 Ragsdale Place Unit 7572036
- 0 Ragsdale Place Unit 8264819
- 0 Ragsdale Place Unit 8253702
- 0 Ragsdale Place Unit 8167133
- 0 Ragsdale Place Unit 7382699
- 0 Ragsdale Place Unit 3086375
- 0 Ragsdale Place
- 109 Ragsdale Place
- 105 Ragsdale Place
- 412 Confederate Ave
- 424 Confederate Ave
- 163 Polk Ave
- 418 Confederate Ave
- 175 Polk Ave