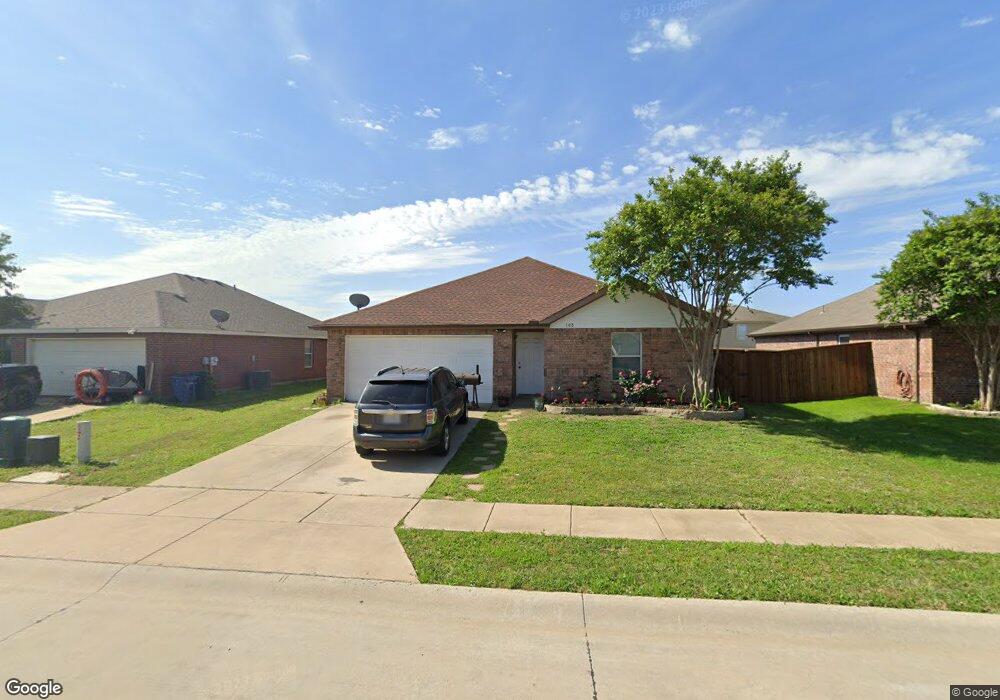
108 Ringneck Dr Sanger, TX 76266
Estimated Value: $280,820 - $303,000
4
Beds
2
Baths
1,760
Sq Ft
$166/Sq Ft
Est. Value
About This Home
This home is located at 108 Ringneck Dr, Sanger, TX 76266 and is currently estimated at $291,955, approximately $165 per square foot. 108 Ringneck Dr is a home located in Denton County with nearby schools including Chisholm Trail Elementary School, Clear Creek Intermediate School, and Sanger Sixth Grade Campus.
Ownership History
Date
Name
Owned For
Owner Type
Purchase Details
Closed on
Aug 12, 2011
Sold by
U S Bank National Association
Bought by
Loa Salome and Loa Maria
Current Estimated Value
Home Financials for this Owner
Home Financials are based on the most recent Mortgage that was taken out on this home.
Original Mortgage
$86,743
Outstanding Balance
$7,094
Interest Rate
4.4%
Mortgage Type
FHA
Estimated Equity
$284,861
Purchase Details
Closed on
Jul 5, 2011
Sold by
Price Cindy E and Price Terry G
Bought by
Us Bank National Association
Home Financials for this Owner
Home Financials are based on the most recent Mortgage that was taken out on this home.
Original Mortgage
$86,743
Outstanding Balance
$7,094
Interest Rate
4.4%
Mortgage Type
FHA
Estimated Equity
$284,861
Purchase Details
Closed on
Nov 23, 2005
Sold by
Nuhome Of Texas
Bought by
Price Terry G
Home Financials for this Owner
Home Financials are based on the most recent Mortgage that was taken out on this home.
Original Mortgage
$87,992
Interest Rate
7.89%
Mortgage Type
Fannie Mae Freddie Mac
Create a Home Valuation Report for This Property
The Home Valuation Report is an in-depth analysis detailing your home's value as well as a comparison with similar homes in the area
Home Values in the Area
Average Home Value in this Area
Purchase History
| Date | Buyer | Sale Price | Title Company |
|---|---|---|---|
| Loa Salome | -- | Servicelink | |
| Us Bank National Association | $74,580 | None Available | |
| Price Terry G | -- | Natgf | |
| Nuhome Of Texas | -- | Natgf |
Source: Public Records
Mortgage History
| Date | Status | Borrower | Loan Amount |
|---|---|---|---|
| Open | Loa Salome | $86,743 | |
| Previous Owner | Price Terry G | $87,992 | |
| Closed | Price Terry G | $21,998 |
Source: Public Records
Tax History
| Year | Tax Paid | Tax Assessment Tax Assessment Total Assessment is a certain percentage of the fair market value that is determined by local assessors to be the total taxable value of land and additions on the property. | Land | Improvement |
|---|---|---|---|---|
| 2025 | $4,493 | $300,397 | $69,300 | $231,097 |
| 2024 | $5,646 | $279,376 | $0 | $0 |
| 2023 | $3,990 | $253,978 | $56,700 | $249,742 |
| 2022 | $5,120 | $230,889 | $56,700 | $192,092 |
| 2021 | $4,412 | $216,791 | $45,675 | $171,116 |
| 2020 | $4,222 | $190,817 | $38,493 | $160,824 |
| 2019 | $3,949 | $173,470 | $38,493 | $140,507 |
| 2018 | $3,610 | $157,700 | $38,493 | $131,507 |
| 2017 | $3,297 | $143,364 | $38,493 | $123,507 |
| 2016 | $2,939 | $130,331 | $38,493 | $104,507 |
| 2015 | $2,297 | $118,483 | $24,192 | $100,808 |
| 2014 | $2,297 | $107,712 | $24,192 | $95,808 |
| 2013 | -- | $97,920 | $24,192 | $88,381 |
Source: Public Records
Map
Nearby Homes
- 117 Teal Rd
- 113 Kincaid Dr
- 140 Ringneck Dr
- 136 Eider Dr
- 124 Morning Glory
- 307 Quail Crossing Dr
- 319 Quail Crossing Dr
- 921 First St
- 0000 Rector Rd
- 185 Aster Dr
- 188 Aster Dr
- 1012 Cowling Rd
- 226 Hillcrest St
- TBD Railroad Ave
- 2004 S Stemmons St
- 505 Houston St
- 113 Diane Dr
- 2000 S Stemmons St
- 315 Jones St
- 117 Kathryn Dr
- 110 Ringneck Dr
- 106 Ringneck Dr
- 109 Maned Dr
- 112 Ringneck Dr
- 107 Maned Dr
- 104 Ringneck Dr
- 111 Maned Dr
- 109 Ringneck Dr
- 105 Maned Dr
- 107 Ringneck Dr
- 113 Maned Dr
- 111 Ringneck Dr
- 114 Ringneck Dr
- 102 Ringneck Dr
- 105 Ringneck Dr
- 113 Ringneck Dr
- 103 Maned Dr
- 103 Ringneck Dr
- 116 Ringneck Dr
- 115 Ringneck Dr
Your Personal Tour Guide
Ask me questions while you tour the home.