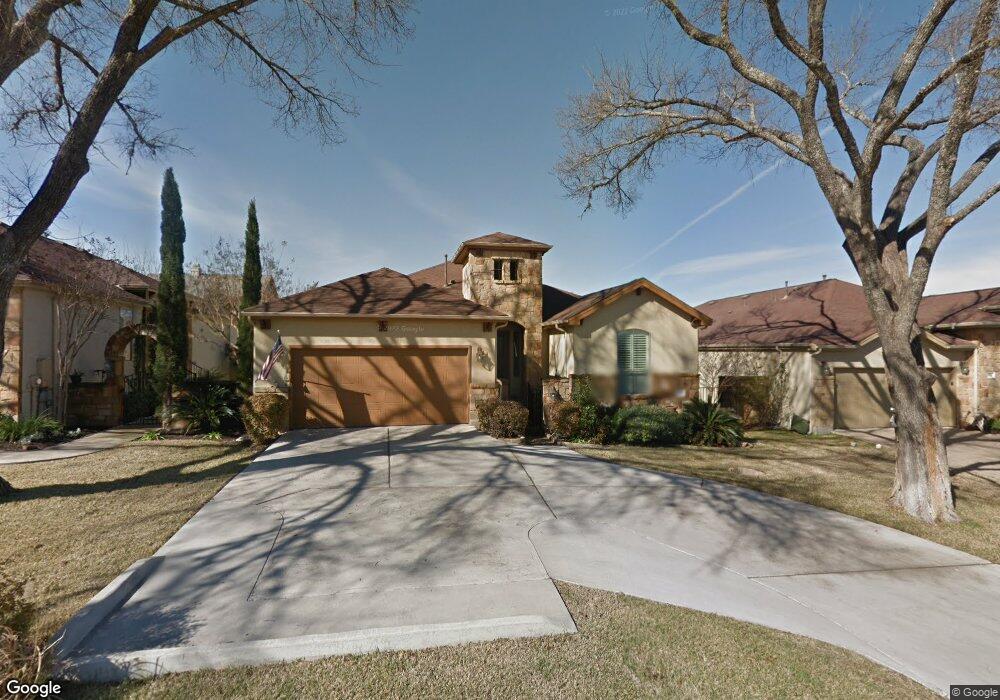
108 Rivulet Ln Unit C1 Austin, TX 78738
Estimated Value: $585,916 - $597,000
2
Beds
2
Baths
1,507
Sq Ft
$392/Sq Ft
Est. Value
About This Home
This home is located at 108 Rivulet Ln Unit C1, Austin, TX 78738 and is currently estimated at $591,479, approximately $392 per square foot. 108 Rivulet Ln Unit C1 is a home located in Travis County with nearby schools including Lakeway Elementary School, Hudson Bend Middle School, and Lake Travis High School.
Ownership History
Date
Name
Owned For
Owner Type
Purchase Details
Closed on
Feb 12, 2026
Sold by
Lanthier Margaret Mary and Ladner Living Trust
Bought by
Wa1sh Llc
Current Estimated Value
Purchase Details
Closed on
Mar 1, 2023
Sold by
Ladner Robert John
Bought by
Ladner Living Trust
Purchase Details
Closed on
Jul 25, 2022
Sold by
Skizim Daniel T
Bought by
Ladner Robert
Home Financials for this Owner
Home Financials are based on the most recent Mortgage that was taken out on this home.
Original Mortgage
$432,500
Interest Rate
5.23%
Mortgage Type
New Conventional
Purchase Details
Closed on
May 5, 2022
Sold by
Dvm & Cls Trust
Bought by
Skizim Daniel T and Skizim Martha K
Home Financials for this Owner
Home Financials are based on the most recent Mortgage that was taken out on this home.
Original Mortgage
$305,000
Interest Rate
4.42%
Mortgage Type
Balloon
Purchase Details
Closed on
Sep 9, 2020
Sold by
Endsley Phillip and Endsley Heather
Bought by
Manchester Diane Virginia and Dvm & Cls Trust
Home Financials for this Owner
Home Financials are based on the most recent Mortgage that was taken out on this home.
Original Mortgage
$287,625
Interest Rate
2.9%
Mortgage Type
New Conventional
Purchase Details
Closed on
Jul 27, 2011
Sold by
Jh Tuscan Village Lp
Bought by
Endsley Phillip and Endsley Heather
Create a Home Valuation Report for This Property
The Home Valuation Report is an in-depth analysis detailing your home's value as well as a comparison with similar homes in the area
Home Values in the Area
Average Home Value in this Area
Purchase History
| Date | Buyer | Sale Price | Title Company |
|---|---|---|---|
| Wa1sh Llc | -- | Independence Title | |
| Ladner Living Trust | -- | -- | |
| Ladner Robert | -- | Texas National Title | |
| Skizim Daniel T | -- | Texas National Title | |
| Manchester Diane Virginia | -- | Texas National Title | |
| Endsley Phillip | -- | None Available |
Source: Public Records
Mortgage History
| Date | Status | Borrower | Loan Amount |
|---|---|---|---|
| Previous Owner | Ladner Robert | $432,500 | |
| Previous Owner | Skizim Daniel T | $305,000 | |
| Previous Owner | Manchester Diane Virginia | $287,625 |
Source: Public Records
Tax History
| Year | Tax Paid | Tax Assessment Tax Assessment Total Assessment is a certain percentage of the fair market value that is determined by local assessors to be the total taxable value of land and additions on the property. | Land | Improvement |
|---|---|---|---|---|
| 2025 | $3,743 | $479,216 | $34,422 | $444,794 |
| 2023 | $4,724 | $628,562 | $20,653 | $607,909 |
| 2022 | $7,637 | $402,160 | $0 | $0 |
| 2021 | $7,351 | $365,600 | $20,653 | $344,947 |
| 2020 | $7,404 | $346,500 | $24,176 | $322,324 |
| 2019 | $7,593 | $346,500 | $24,176 | $322,324 |
| 2018 | $7,936 | $357,799 | $24,176 | $333,623 |
| 2017 | $7,069 | $318,000 | $24,176 | $293,824 |
| 2016 | $7,186 | $315,031 | $30,448 | $284,583 |
| 2015 | $6,788 | $332,000 | $70,000 | $262,000 |
| 2014 | $6,788 | $292,871 | $70,000 | $222,871 |
Source: Public Records
Map
Nearby Homes
- 102 Rivulet Ln
- 404 Amiata Ave Unit 34
- 108 Rivalto Cir Unit 2
- 108 Rivalto Cir Unit C3
- 106 Bella Toscana Ave Unit 3204
- 106 Bella Toscana Ave Unit 3208
- 104 Bella Toscana Ave Unit 2302
- 104 Bella Toscana Ave Unit 2106
- 102 Bella Toscana Ave Unit 1304
- 102 Bella Toscana Ave Unit 1205
- 102 Bella Toscana Ave Unit 1103
- 104 Rivalto Cir Unit 1
- 2050 Lohmans Spur Rd Unit 2203
- 2050 Lohmans Spur Rd Unit 101
- 2050 Lohmans Spur Unit 1804
- 304 Belforte Ave
- 8 Hightrail Way
- 208 Neville Wood Ct
- 108 Golden Bear Cove
- 2200 Ranch Road 620 S
- 108 Rivulet Ln Unit 5
- 108 Rivulet Ln Unit C5
- 108 Rivulet Ln Unit C4
- 108 Rivulet Ln Unit C3
- 108 Rivulet Ln Unit C2
- 108 Rivulet Ln
- 106 Rivulet Ln
- 110 Rivulet Ln Unit 3
- 110 Rivulet Ln Unit A4
- 110 Rivulet Ln Unit A3
- 110 Rivulet Ln Unit A2
- 110 Rivulet Ln Unit A1
- 110 Rivulet Ln
- 110 Rivulet Ln Unit 2
- 110 Rivulet Ln Unit 3
- 112 Rivulet Ln
- 104 Rivulet Ln
- 203 Amiata Ave Unit 97
- 203 Amiata Ave
- 301 Amiata Ave Unit 95
Your Personal Tour Guide
Ask me questions while you tour the home.