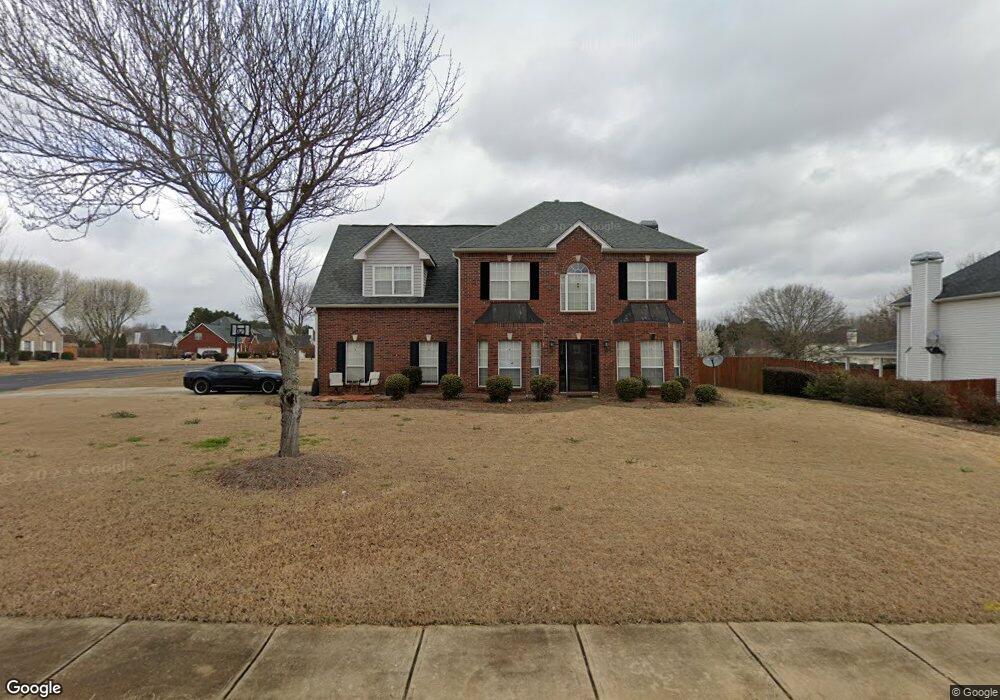
108 Rowanshyre Way Unit 143 McDonough, GA 30253
Estimated Value: $339,000 - $368,000
4
Beds
3
Baths
2,292
Sq Ft
$154/Sq Ft
Est. Value
About This Home
This home is located at 108 Rowanshyre Way Unit 143, McDonough, GA 30253 and is currently estimated at $352,881, approximately $153 per square foot. 108 Rowanshyre Way Unit 143 is a home located in Henry County with nearby schools including Dutchtown Elementary School, Dutchtown Middle School, and Dutchtown High School.
Ownership History
Date
Name
Owned For
Owner Type
Purchase Details
Closed on
Dec 28, 2020
Sold by
Waugh Andrea L
Bought by
Jones Roberts Rhoconda
Current Estimated Value
Home Financials for this Owner
Home Financials are based on the most recent Mortgage that was taken out on this home.
Original Mortgage
$229,761
Outstanding Balance
$204,556
Interest Rate
2.7%
Mortgage Type
FHA
Estimated Equity
$148,325
Purchase Details
Closed on
Jan 8, 2019
Sold by
Caldwell Bryant Ellis
Bought by
Waugh-Caldwell Andrea Lavette
Purchase Details
Closed on
Sep 14, 2001
Sold by
Greenwood Homes Inc
Bought by
Caldwell Bryant E and Caldwell Andrea W
Home Financials for this Owner
Home Financials are based on the most recent Mortgage that was taken out on this home.
Original Mortgage
$167,550
Interest Rate
6.97%
Mortgage Type
VA
Create a Home Valuation Report for This Property
The Home Valuation Report is an in-depth analysis detailing your home's value as well as a comparison with similar homes in the area
Home Values in the Area
Average Home Value in this Area
Purchase History
| Date | Buyer | Sale Price | Title Company |
|---|---|---|---|
| Jones Roberts Rhoconda | $234,000 | -- | |
| Waugh-Caldwell Andrea Lavette | -- | -- | |
| Caldwell Bryant E | $162,700 | -- |
Source: Public Records
Mortgage History
| Date | Status | Borrower | Loan Amount |
|---|---|---|---|
| Open | Jones Roberts Rhoconda | $229,761 | |
| Previous Owner | Caldwell Bryant E | $167,550 |
Source: Public Records
Tax History Compared to Growth
Tax History
| Year | Tax Paid | Tax Assessment Tax Assessment Total Assessment is a certain percentage of the fair market value that is determined by local assessors to be the total taxable value of land and additions on the property. | Land | Improvement |
|---|---|---|---|---|
| 2025 | $5,200 | $129,760 | $16,000 | $113,760 |
| 2024 | $5,200 | $142,320 | $16,000 | $126,320 |
| 2023 | $5,522 | $142,120 | $14,000 | $128,120 |
| 2022 | $4,303 | $110,320 | $14,000 | $96,320 |
| 2021 | $3,561 | $91,000 | $14,000 | $77,000 |
| 2020 | $71 | $75,400 | $10,000 | $65,400 |
| 2019 | $71 | $71,640 | $10,000 | $61,640 |
| 2018 | $71 | $64,240 | $10,000 | $54,240 |
| 2016 | $2,162 | $54,520 | $10,000 | $44,520 |
| 2015 | $2,456 | $60,320 | $8,000 | $52,320 |
| 2014 | $2,197 | $53,160 | $8,000 | $45,160 |
Source: Public Records
Map
Nearby Homes
- 1086 Rowanshyre Cir
- 208 Danvers St
- 0 Mount Carmel Rd Unit 10597675
- 217 Westwinds Trail
- 1253 Burlington Ct
- 1261 Burlington Ct
- 1141 Burlington Ct
- 701 Bickmore Dr
- Palladio Plan at Newberry 55+
- Bramante Ranch Plan at Newberry 55+
- Palladio 2-Story Plan at Newberry 55+
- Griffin Hall Plan at Newberry 55+
- Anderson Plan at Newberry 55+
- 355 Orleans Blvd
- 130 Mount Carmel Rd
- 774 Mill Rd
- 340 Foxglove Way
- 445 Royal St
- 344 Foxglove Way
- 324 Foxglove Way
- 108 Rowanshyre Way Unit 1
- 205 Sheffield Chase Unit 1
- 112 Rowanshyre Way Unit 1
- 113 Rowanshyre Way
- 200 Sheffield Chase Unit 1
- 401 Bedford Crossing Unit 1
- 215 Sheffield Chase
- 116 Rowanshyre Way
- 116 Rowanshyre Way Unit 1
- 204 Sheffield Chase Unit 1
- 109 Rowanshyre Way
- 109 Rowanshyre Way Unit 1
- 227 Sheffield Chase
- 208 Sheffield Chase
- 231 Sheffield Chase Unit 1
- 400 Bedford Crossing
- 400 Bedford Crossing Unit 1
- 105 Rowanshyre Way
- 105 Rowanshyre Way Unit 1
- 120 Rowanshyre Way Unit 1