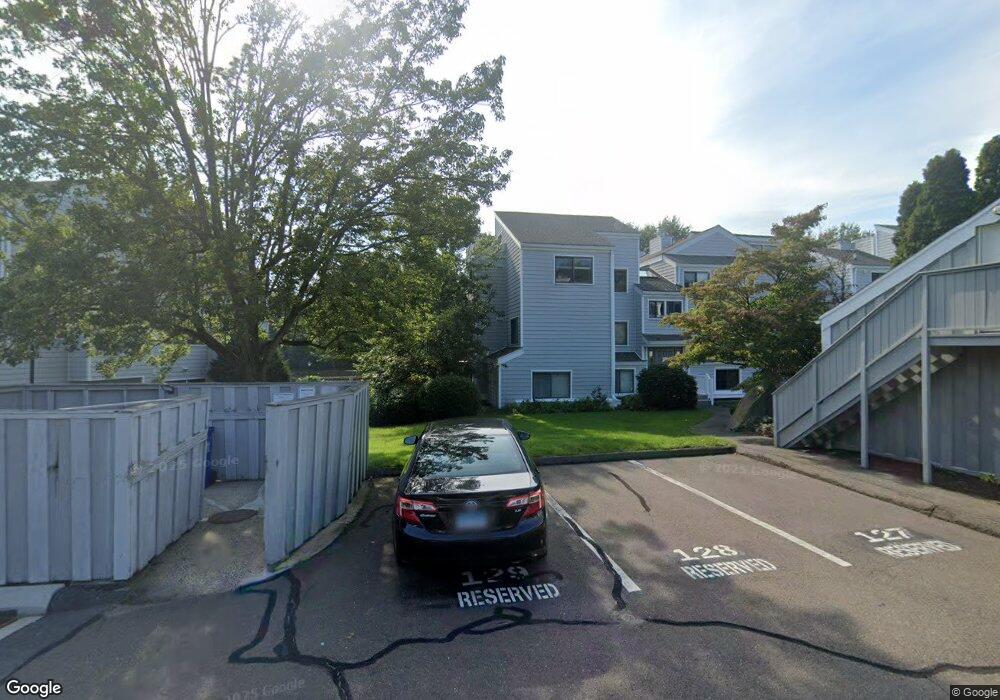
108 Rowayton Woods Dr Norwalk, CT 06854
Brookside NeighborhoodEstimated Value: $649,000 - $813,000
3
Beds
3
Baths
2,073
Sq Ft
$341/Sq Ft
Est. Value
About This Home
This home is located at 108 Rowayton Woods Dr, Norwalk, CT 06854 and is currently estimated at $706,483, approximately $340 per square foot. 108 Rowayton Woods Dr is a home located in Fairfield County with nearby schools including Brookside Elementary School, Roton Middle School, and Brien Mcmahon High School.
Ownership History
Date
Name
Owned For
Owner Type
Purchase Details
Closed on
Nov 25, 2014
Sold by
Barere Joan
Bought by
Cramer Joseph
Current Estimated Value
Home Financials for this Owner
Home Financials are based on the most recent Mortgage that was taken out on this home.
Original Mortgage
$288,000
Outstanding Balance
$222,303
Interest Rate
4.13%
Mortgage Type
New Conventional
Estimated Equity
$484,180
Purchase Details
Closed on
Jun 19, 2007
Sold by
Barrett Sherry L
Bought by
Barere Lund
Purchase Details
Closed on
Dec 5, 2003
Sold by
Mckiernan Kevin
Bought by
Barrett Sherry L
Purchase Details
Closed on
Apr 9, 1998
Sold by
Texas Commerce Bk
Bought by
Mckiernan Kevin
Purchase Details
Closed on
Jul 1, 1991
Sold by
Fisher Russell and Fisher Kathleen
Bought by
Millard Patricia
Create a Home Valuation Report for This Property
The Home Valuation Report is an in-depth analysis detailing your home's value as well as a comparison with similar homes in the area
Home Values in the Area
Average Home Value in this Area
Purchase History
| Date | Buyer | Sale Price | Title Company |
|---|---|---|---|
| Cramer Joseph | $360,000 | -- | |
| Cramer Joseph | $360,000 | -- | |
| Barere Lund | $510,000 | -- | |
| Barere Lund | $510,000 | -- | |
| Barrett Sherry L | $412,500 | -- | |
| Barrett Sherry L | $412,500 | -- | |
| Mckiernan Kevin | $187,500 | -- | |
| Mckiernan Kevin | $187,500 | -- | |
| Millard Patricia | $215,000 | -- |
Source: Public Records
Mortgage History
| Date | Status | Borrower | Loan Amount |
|---|---|---|---|
| Open | Millard Patricia | $288,000 | |
| Closed | Millard Patricia | $288,000 |
Source: Public Records
Tax History Compared to Growth
Tax History
| Year | Tax Paid | Tax Assessment Tax Assessment Total Assessment is a certain percentage of the fair market value that is determined by local assessors to be the total taxable value of land and additions on the property. | Land | Improvement |
|---|---|---|---|---|
| 2025 | $9,260 | $390,050 | $0 | $390,050 |
| 2024 | $9,117 | $390,050 | $0 | $390,050 |
| 2023 | $7,336 | $293,830 | $0 | $293,830 |
| 2022 | $7,221 | $293,830 | $0 | $293,830 |
| 2021 | $6,144 | $293,830 | $0 | $293,830 |
| 2020 | $6,936 | $293,830 | $0 | $293,830 |
| 2019 | $6,848 | $293,830 | $0 | $293,830 |
| 2018 | $6,868 | $264,870 | $0 | $264,870 |
| 2017 | $6,628 | $264,870 | $0 | $264,870 |
| 2016 | $6,738 | $264,870 | $0 | $264,870 |
| 2015 | $6,052 | $264,870 | $0 | $264,870 |
| 2014 | $6,632 | $264,870 | $0 | $264,870 |
Source: Public Records
Map
Nearby Homes
- 133 Rowayton Woods Dr
- 171 Rowayton Woods Dr Unit 171
- 40 Arnold Ln
- 181 Highland Ave
- 19 Woodchuck Ct
- 9 Hollow Spring Rd
- 5 Rockland Rd Unit A8
- 108 Witch Ln
- 28 Old Trolley Way
- 47 Glasser St
- 7 Hadik Pkwy
- 9 Observatory Place Unit A
- 209 Rowayton Ave
- 1 Flicker Ln
- 52 Lexington Ave
- 19 Littlebrook Rd
- 166 Rowayton Ave Unit 2
- 18 Soundview Ave
- 5 Outer Rd
- 17 Woodlawn Ave
- 114 Rowayton Woods Dr
- 112 Rowayton Woods Dr
- 110 Rowayton Woods Dr
- 108 Rowayton Woods Dr Unit 108
- 114 Rowayton Woods Dr Unit 114
- 63 Rowayton Woods Dr
- 58 Rowayton Woods Dr
- 60 Rowayton Woods Dr
- 60 Rowayton Woods Dr Unit 60
- 64 Rowayton Woods Dr
- 61 Rowayton Woods Dr
- 62 Rowayton Woods Dr
- 62 Rowayton Woods Dr Unit 62
- 65 Rowayton Woods Dr
- 66 Rowayton Woods Dr
- 65 Rowayton Woods Dr Unit 65
- 59 Rowayton Woods Dr
- 59 Rowayton Woods Dr Unit 59
- 88 Rowayton Woods Dr
- 89 Rowayton Woods Dr