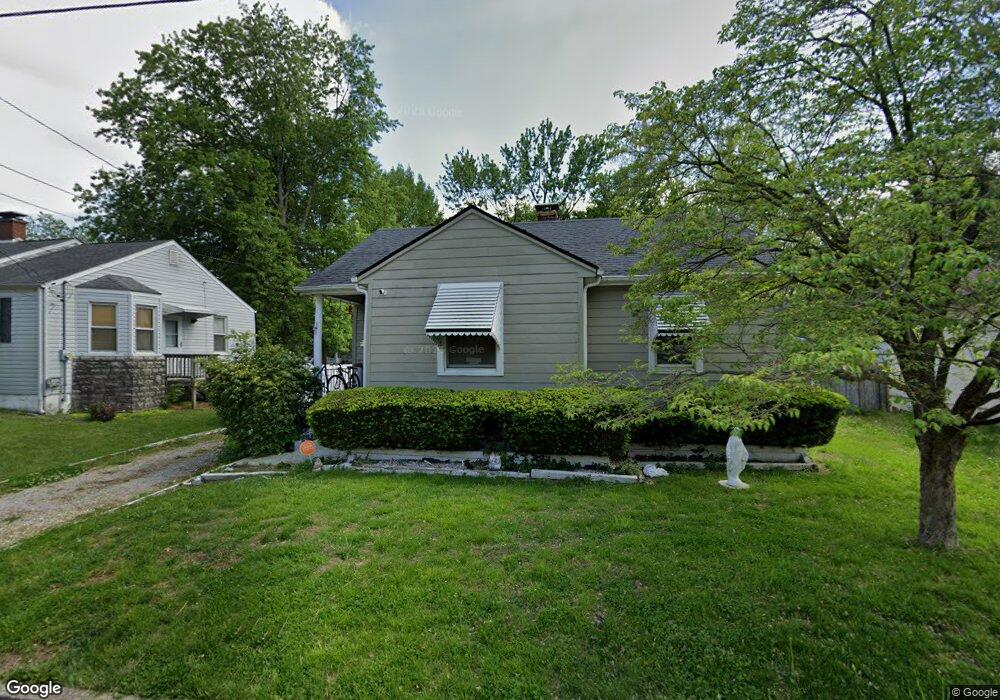
108 S 37th St Belleville, IL 62226
Estimated Value: $97,000 - $122,000
Studio
--
Bath
810
Sq Ft
$135/Sq Ft
Est. Value
About This Home
This home is located at 108 S 37th St, Belleville, IL 62226 and is currently estimated at $109,569, approximately $135 per square foot. 108 S 37th St is a home located in St. Clair County with nearby schools including Union Elementary School, West Jr High School, and Our Lady Queen Of Peace Catholic School.
Ownership History
Date
Name
Owned For
Owner Type
Purchase Details
Closed on
Feb 11, 2026
Sold by
Freedom Mortgage Corp
Bought by
Va
Current Estimated Value
Purchase Details
Closed on
Jan 20, 2026
Sold by
Private Sales Corp
Bought by
Freedom Mortgage Corp
Purchase Details
Closed on
Apr 30, 2007
Sold by
Burgner Jeffrey S and Burgner Jenny Lynn
Bought by
Howard Peggy
Home Financials for this Owner
Home Financials are based on the most recent Mortgage that was taken out on this home.
Original Mortgage
$75,821
Interest Rate
6.18%
Mortgage Type
VA
Purchase Details
Closed on
Feb 2, 2007
Sold by
Mullett Gregory A
Bought by
Burgner Jeffrey S and Burgner Jenny Lynn
Create a Home Valuation Report for This Property
The Home Valuation Report is an in-depth analysis detailing your home's value as well as a comparison with similar homes in the area
Home Values in the Area
Average Home Value in this Area
Purchase History
| Date | Buyer | Sale Price | Title Company |
|---|---|---|---|
| Va | -- | None Available | |
| Freedom Mortgage Corp | -- | None Available | |
| Howard Peggy | $81,000 | Benchmark Title Company | |
| Burgner Jeffrey S | $35,000 | Benchmark Title Company |
Source: Public Records
Mortgage History
| Date | Status | Borrower | Loan Amount |
|---|---|---|---|
| Previous Owner | Howard Peggy | $75,821 |
Source: Public Records
Tax History
| Year | Tax Paid | Tax Assessment Tax Assessment Total Assessment is a certain percentage of the fair market value that is determined by local assessors to be the total taxable value of land and additions on the property. | Land | Improvement |
|---|---|---|---|---|
| 2024 | $1,971 | $28,416 | $4,260 | $24,156 |
| 2023 | $1,781 | $24,975 | $4,177 | $20,798 |
| 2022 | $1,578 | $22,483 | $3,760 | $18,723 |
| 2021 | $1,474 | $20,785 | $3,476 | $17,309 |
| 2020 | $1,407 | $19,655 | $3,287 | $16,368 |
| 2019 | $1,605 | $21,977 | $3,291 | $18,686 |
| 2018 | $1,605 | $21,502 | $3,220 | $18,282 |
| 2017 | $0 | $20,860 | $3,198 | $17,662 |
| 2016 | $0 | $20,417 | $3,130 | $17,287 |
| 2014 | $938 | $21,144 | $3,899 | $17,245 |
| 2013 | $1,019 | $21,447 | $3,955 | $17,492 |
Source: Public Records
Map
Nearby Homes
Your Personal Tour Guide
Ask me questions while you tour the home.