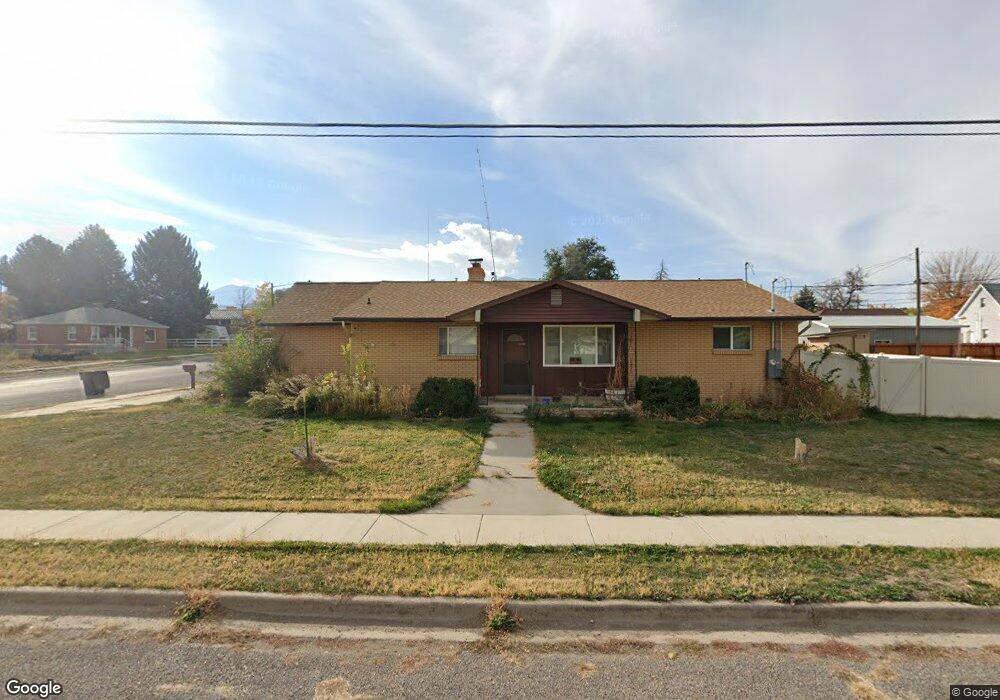
108 S 400 E Payson, UT 84651
Estimated Value: $432,936 - $477,000
3
Beds
2
Baths
1,599
Sq Ft
$286/Sq Ft
Est. Value
About This Home
This home is located at 108 S 400 E, Payson, UT 84651 and is currently estimated at $457,312, approximately $285 per square foot. 108 S 400 E is a home located in Utah County with nearby schools including Park View Elementary, Payson High School, and Payson Junior High School.
Ownership History
Date
Name
Owned For
Owner Type
Purchase Details
Closed on
Feb 1, 2024
Sold by
Deeben Derick Roy
Bought by
Deeben Nephi and Bothell Brianna
Current Estimated Value
Home Financials for this Owner
Home Financials are based on the most recent Mortgage that was taken out on this home.
Original Mortgage
$316,000
Outstanding Balance
$310,426
Interest Rate
6.62%
Mortgage Type
New Conventional
Estimated Equity
$146,886
Purchase Details
Closed on
Nov 18, 2016
Sold by
Huntamn Elanie P and Huntamn Carlyn P
Bought by
Deeben Derick Roy
Home Financials for this Owner
Home Financials are based on the most recent Mortgage that was taken out on this home.
Original Mortgage
$215,350
Interest Rate
3.42%
Mortgage Type
VA
Purchase Details
Closed on
Jul 29, 2002
Sold by
Ashworth Charlene K
Bought by
Wilson Brad and Wilson Jessica
Home Financials for this Owner
Home Financials are based on the most recent Mortgage that was taken out on this home.
Original Mortgage
$117,000
Interest Rate
6.87%
Create a Home Valuation Report for This Property
The Home Valuation Report is an in-depth analysis detailing your home's value as well as a comparison with similar homes in the area
Home Values in the Area
Average Home Value in this Area
Purchase History
| Date | Buyer | Sale Price | Title Company |
|---|---|---|---|
| Deeben Nephi | -- | Meridian Title Company | |
| Deeben Derick Roy | -- | Key Land Tiutle | |
| Wilson Brad | -- | Equity Title Agency Inc |
Source: Public Records
Mortgage History
| Date | Status | Borrower | Loan Amount |
|---|---|---|---|
| Open | Deeben Nephi | $316,000 | |
| Previous Owner | Deeben Derick Roy | $215,350 | |
| Previous Owner | Wilson Brad | $117,000 |
Source: Public Records
Tax History
| Year | Tax Paid | Tax Assessment Tax Assessment Total Assessment is a certain percentage of the fair market value that is determined by local assessors to be the total taxable value of land and additions on the property. | Land | Improvement |
|---|---|---|---|---|
| 2025 | $2,013 | $220,110 | -- | -- |
| 2024 | $2,013 | $204,820 | $0 | $0 |
| 2023 | $2,247 | $209,770 | $0 | $0 |
| 2022 | $2,247 | $225,555 | $0 | $0 |
| 2021 | $1,860 | $299,400 | $88,400 | $211,000 |
| 2020 | $1,510 | $279,800 | $80,400 | $199,400 |
| 2019 | $1,510 | $243,900 | $69,400 | $174,500 |
| 2018 | $1,350 | $210,100 | $58,400 | $151,700 |
| 2017 | $1,367 | $114,400 | $0 | $0 |
| 2016 | $1,341 | $111,540 | $0 | $0 |
| 2015 | $1,180 | $97,460 | $0 | $0 |
| 2014 | $1,048 | $87,175 | $0 | $0 |
Source: Public Records
Map
Nearby Homes
Your Personal Tour Guide
Ask me questions while you tour the home.