Estimated Value: $143,000 - $163,000
--
Bed
1
Bath
1,474
Sq Ft
$103/Sq Ft
Est. Value
About This Home
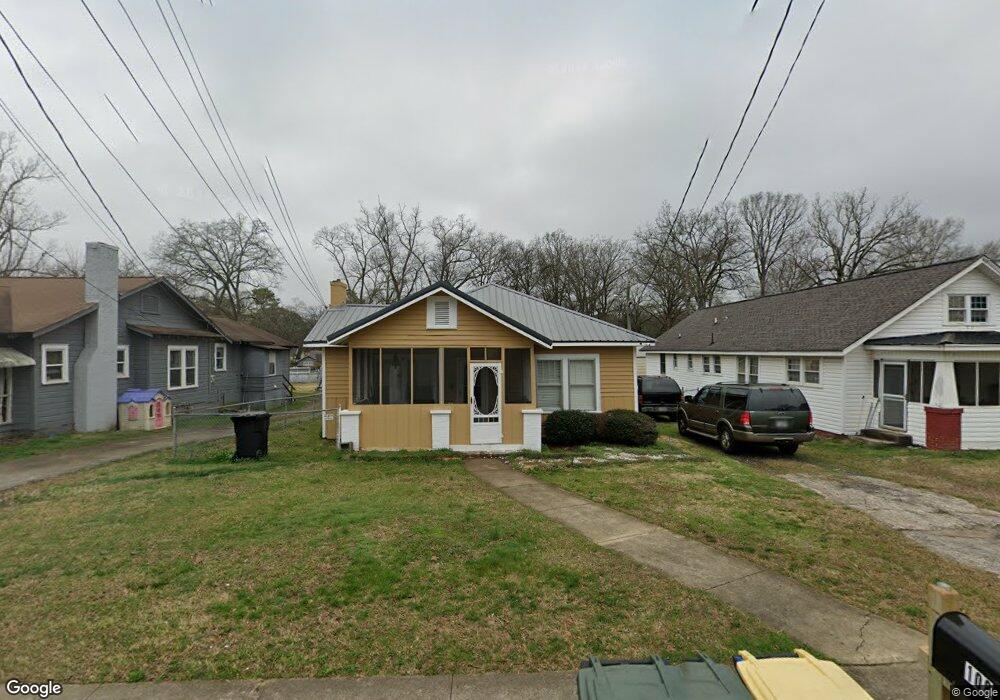
This home is located at 108 S Elm St SW, Rome, GA 30165 and is currently estimated at $151,486, approximately $102 per square foot. 108 S Elm St SW is a home located in Floyd County with nearby schools including Rome High School and St. Mary School.
Ownership History
Date
Name
Owned For
Owner Type
Purchase Details
Closed on
Sep 18, 2000
Sold by
Magness Lily B
Bought by
Hayes Cynthia L
Current Estimated Value
Purchase Details
Closed on
Jul 22, 2000
Sold by
Secretary Of Housing And Urban Developme
Bought by
Magness Lily B
Purchase Details
Closed on
Mar 7, 2000
Sold by
Aurora Loan Services Inc
Bought by
Secretary Of Housing And Urban Developme
Purchase Details
Closed on
Sep 27, 1996
Sold by
Erwin Mike and Erwin Marie
Bought by
Lecroy Timothy
Purchase Details
Closed on
Feb 21, 1983
Sold by
Duncan David W and Duncan Sherry T
Bought by
Erwin Mike and Erwin Marie
Purchase Details
Closed on
Jul 7, 1981
Sold by
Duncan W C
Bought by
Duncan David W and Duncan Sherry T
Purchase Details
Closed on
Jan 1, 1973
Sold by
Capes Bertice M
Bought by
Duncan W C
Purchase Details
Closed on
Sep 9, 1964
Sold by
Erwin John W
Bought by
Capes Bertice M
Purchase Details
Closed on
Aug 13, 1962
Sold by
Womack Sarah O
Bought by
Erwin John W
Purchase Details
Closed on
Jan 1, 1901
Bought by
Womack Sarah O
Create a Home Valuation Report for This Property
The Home Valuation Report is an in-depth analysis detailing your home's value as well as a comparison with similar homes in the area
Home Values in the Area
Average Home Value in this Area
Purchase History
| Date | Buyer | Sale Price | Title Company |
|---|---|---|---|
| Hayes Cynthia L | $78,000 | -- | |
| Magness Lily B | $47,000 | -- | |
| Secretary Of Housing And Urban Developme | $46,400 | -- | |
| Aurora Loan Services Inc | $46,400 | -- | |
| Lecroy Timothy | $43,900 | -- | |
| Erwin Mike | $24,500 | -- | |
| Duncan David W | $2,000 | -- | |
| Duncan W C | -- | -- | |
| Capes Bertice M | -- | -- | |
| Erwin John W | -- | -- | |
| Womack Sarah O | -- | -- |
Source: Public Records
Tax History Compared to Growth
Tax History
| Year | Tax Paid | Tax Assessment Tax Assessment Total Assessment is a certain percentage of the fair market value that is determined by local assessors to be the total taxable value of land and additions on the property. | Land | Improvement |
|---|---|---|---|---|
| 2024 | $980 | $44,764 | $6,357 | $38,407 |
| 2023 | $939 | $42,438 | $5,650 | $36,788 |
| 2022 | $845 | $35,395 | $4,709 | $30,686 |
| 2021 | $803 | $32,334 | $4,709 | $27,625 |
| 2020 | $759 | $29,621 | $3,532 | $26,089 |
| 2019 | $729 | $28,106 | $3,532 | $24,574 |
| 2018 | $703 | $26,592 | $3,532 | $23,060 |
| 2017 | $687 | $25,670 | $3,532 | $22,138 |
| 2016 | $706 | $26,743 | $3,520 | $23,223 |
| 2015 | -- | $26,743 | $3,520 | $23,223 |
| 2014 | -- | $26,743 | $3,520 | $23,223 |
Source: Public Records
Map
Nearby Homes
- 204 Cherry St SW
- 8 S Hughes St SW
- 8 Leon St SW
- 50 Melton Ave SW
- 21 Sweetspire Dr NW
- 23 Sweetspire Dr NW
- 15 Silverbell Ln
- 0 Mount Alto Rd SW Unit 10523740
- 40 Paris Dr SW
- 13 Ridgewood Rd SW
- 214 N Elm St NW
- 14 Berckman Ln SW
- 3 Berckman Ln SW
- 100 Dellwood Dr NW
- 311 Wilkerson Rd SW
- 19 Berckman Ln SW
- 313 Wilkerson Rd SW
- 207 Paris Dr SW
- 55 Ridgewood Rd SW
- 209 Sherwood Rd SW
- 106 S Elm St SW
- 110 S Elm St SW
- 104 S Elm St SW
- 114 S Elm St SW
- 102 S Elm St SW
- 1007 Ethel Ave SW
- 116 S Elm St SW
- S S Elm St SW Unit A
- S S Elm St SW
- 109 S Sycamore St SW
- 111 S Sycamore St SW
- 100 S Elm St SW
- 1009A Ethel Ave SW
- 1009 Ethel Ave SW
- 113 S Sycamore St SW
- 107 S Elm St SW
- 109 S Elm St SW
- 105 S Elm St SW
- 105 S Sycamore St SW
- 111 S Elm St SW