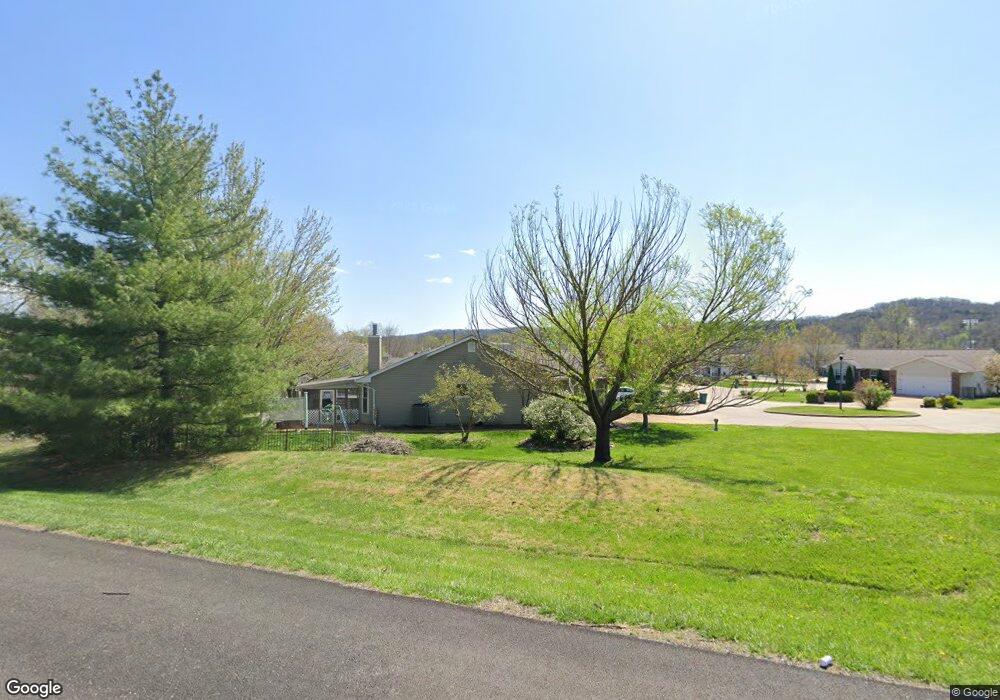
108 Seckman Spring Cir Imperial, MO 63052
Estimated Value: $360,287 - $391,000
3
Beds
3
Baths
1,648
Sq Ft
$228/Sq Ft
Est. Value
About This Home
This home is located at 108 Seckman Spring Cir, Imperial, MO 63052 and is currently estimated at $375,572, approximately $227 per square foot. 108 Seckman Spring Cir is a home located in Jefferson County with nearby schools including Seckman Elementary School, Seckman Middle School, and Seckman Senior High School.
Ownership History
Date
Name
Owned For
Owner Type
Purchase Details
Closed on
May 25, 2010
Sold by
Wilson Wade T and Wilson Jane E
Bought by
Weiland Stacy Dean
Current Estimated Value
Home Financials for this Owner
Home Financials are based on the most recent Mortgage that was taken out on this home.
Original Mortgage
$182,750
Outstanding Balance
$122,190
Interest Rate
5%
Mortgage Type
New Conventional
Estimated Equity
$253,382
Purchase Details
Closed on
Jul 28, 2000
Sold by
Raleigh Homes Inc
Bought by
Wilson Wade T and Wilson Jane E
Home Financials for this Owner
Home Financials are based on the most recent Mortgage that was taken out on this home.
Original Mortgage
$137,500
Interest Rate
5.99%
Purchase Details
Closed on
Apr 12, 2000
Sold by
Kaplan Development & Inv Co Inc
Bought by
Raleigh Homes Inc
Home Financials for this Owner
Home Financials are based on the most recent Mortgage that was taken out on this home.
Original Mortgage
$128,828
Interest Rate
8.13%
Create a Home Valuation Report for This Property
The Home Valuation Report is an in-depth analysis detailing your home's value as well as a comparison with similar homes in the area
Home Values in the Area
Average Home Value in this Area
Purchase History
| Date | Buyer | Sale Price | Title Company |
|---|---|---|---|
| Weiland Stacy Dean | -- | Tri | |
| Wilson Wade T | -- | Commonwealth Title | |
| Raleigh Homes Inc | -- | Commonwealth Title |
Source: Public Records
Mortgage History
| Date | Status | Borrower | Loan Amount |
|---|---|---|---|
| Open | Weiland Stacy Dean | $182,750 | |
| Previous Owner | Wilson Wade T | $137,500 | |
| Previous Owner | Raleigh Homes Inc | $128,828 |
Source: Public Records
Tax History Compared to Growth
Tax History
| Year | Tax Paid | Tax Assessment Tax Assessment Total Assessment is a certain percentage of the fair market value that is determined by local assessors to be the total taxable value of land and additions on the property. | Land | Improvement |
|---|---|---|---|---|
| 2025 | $2,302 | $38,100 | $5,900 | $32,200 |
| 2024 | $2,302 | $33,800 | $4,800 | $29,000 |
| 2023 | $2,302 | $33,800 | $4,800 | $29,000 |
| 2022 | $2,300 | $33,800 | $4,800 | $29,000 |
| 2021 | $2,301 | $33,800 | $4,800 | $29,000 |
| 2020 | $2,222 | $30,500 | $4,200 | $26,300 |
| 2019 | $2,220 | $30,500 | $4,200 | $26,300 |
| 2018 | $2,201 | $30,500 | $4,200 | $26,300 |
| 2017 | $2,127 | $30,500 | $4,200 | $26,300 |
| 2016 | $1,955 | $28,000 | $4,000 | $24,000 |
| 2015 | $1,931 | $28,000 | $4,000 | $24,000 |
| 2013 | $1,931 | $27,500 | $4,000 | $23,500 |
Source: Public Records
Map
Nearby Homes
- 1045 Remington Dr
- 1 Sydney @ Arlington Heights
- 5144 Copperleaf Dr
- 5030 Brook Dr
- 5160 Cedar Saddle
- 22 Sun Ridge Estates
- 3103 Valley Oaks Dr
- 2406 Lombard Ln
- 2705 Kenny Ln
- 5034 Countryside Dr
- 2741 Whitecreek Ln
- 2532 Breakwater Dr
- 2901 Jack Lynn Dr
- 5009 Countryside Dr
- 2509 Prairie Hollow Rd
- 1008 Baypointe Dr
- 1020 Timber Creek Ln
- 1011 Frisco Hollows Rd
- 5106 Bald Eagle Ct
- 1051 Timber Creek Ln
- 2315 Seckman Spring Ct
- 104 Seckman Spring Cir
- 2311 Seckman Spring Ct
- 2322 Seckman Springs
- 2316 Seckman Spring Ct
- 109 Seckman Spring Cir
- 2324 Seckman Spring Ct
- 105 Seckman Spring Cir
- 101 Seckman Spring Cir
- 2307 Seckman Spring Ct
- 2306 Seckman Spring Ct
- 2327 Seckman Spring Ct
- 2332 Seckman Spring Ct
- 2301 Seckman Spring Ct
- 2778 Mallard Ct
- 2774 Mallard Ct
- 2782 Mallard (Lot 100 Remington) Ct
- 2300 Seckman Spring Ct
- 2331 Seckman Spring Ct
- 5209 Seckman Spring Dr