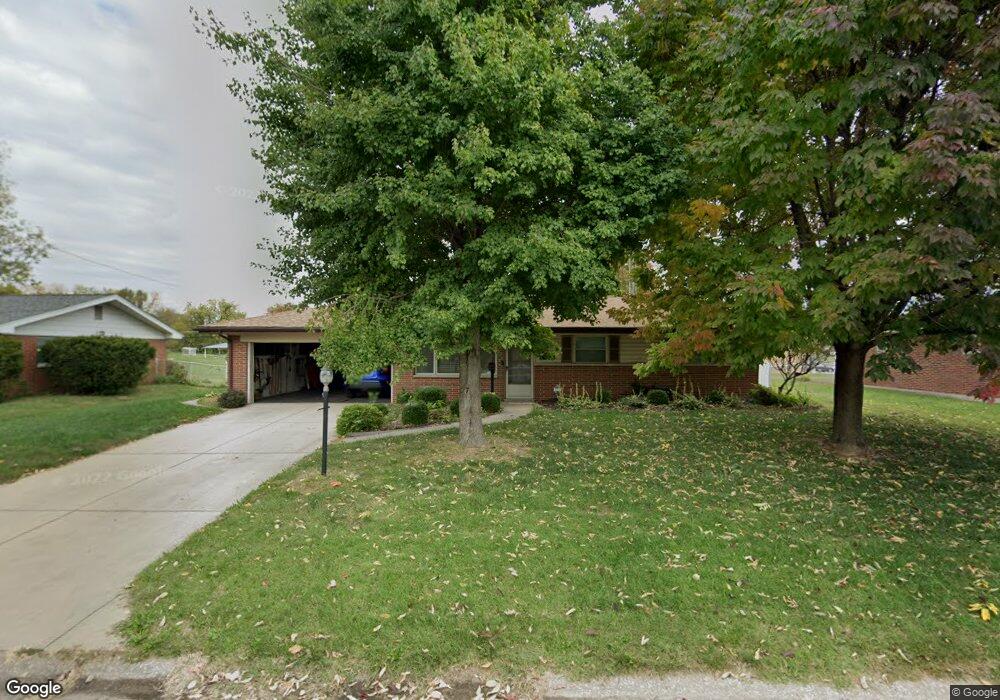
108 Sheffield Dr Belleville, IL 62223
Estimated Value: $117,846 - $179,000
Studio
--
Bath
991
Sq Ft
$151/Sq Ft
Est. Value
About This Home
This home is located at 108 Sheffield Dr, Belleville, IL 62223 and is currently estimated at $149,712, approximately $151 per square foot. 108 Sheffield Dr is a home located in St. Clair County with nearby schools including Ellis Elementary School, Emge Junior High School, and Our Lady Queen Of Peace Catholic School.
Ownership History
Date
Name
Owned For
Owner Type
Purchase Details
Closed on
Dec 7, 2021
Sold by
Peak Janice L and Peak Leonard A
Bought by
Peak Leonard A
Current Estimated Value
Purchase Details
Closed on
Nov 21, 2018
Sold by
Peak Leonard A and Peak Janice L
Bought by
Peak Leonard A and Peak Janice L
Purchase Details
Closed on
May 30, 2012
Sold by
Peak Leonard A and Peak Janice L
Bought by
Peak Leonard A and Peak Janice L
Home Financials for this Owner
Home Financials are based on the most recent Mortgage that was taken out on this home.
Original Mortgage
$84,133
Outstanding Balance
$11,872
Interest Rate
3%
Mortgage Type
FHA
Estimated Equity
$137,840
Purchase Details
Closed on
Feb 2, 2006
Sold by
Peak Leonard A and Peak Janice L
Bought by
Peak Leoanrd A and Peak Janice L
Purchase Details
Closed on
Aug 1, 1995
Bought by
Peak Leonard A and Peak Janice L
Create a Home Valuation Report for This Property
The Home Valuation Report is an in-depth analysis detailing your home's value as well as a comparison with similar homes in the area
Home Values in the Area
Average Home Value in this Area
Purchase History
| Date | Buyer | Sale Price | Title Company |
|---|---|---|---|
| Peak Leonard A | -- | Attorney | |
| Peak Leonard A | -- | Attorney | |
| Peak Leonard A | -- | Clear Title Group | |
| Peak Leoanrd A | -- | None Available | |
| Peak Leonard A | $52,900 | -- |
Source: Public Records
Mortgage History
| Date | Status | Borrower | Loan Amount |
|---|---|---|---|
| Open | Peak Leonard A | $84,133 |
Source: Public Records
Tax History
| Year | Tax Paid | Tax Assessment Tax Assessment Total Assessment is a certain percentage of the fair market value that is determined by local assessors to be the total taxable value of land and additions on the property. | Land | Improvement |
|---|---|---|---|---|
| 2024 | $1,809 | $40,476 | $10,387 | $30,089 |
| 2023 | $1,883 | $36,318 | $9,320 | $26,998 |
| 2022 | $2,002 | $32,956 | $8,457 | $24,499 |
| 2021 | $1,853 | $30,597 | $7,852 | $22,745 |
| 2020 | $1,715 | $28,331 | $7,639 | $20,692 |
| 2019 | $1,689 | $28,331 | $7,639 | $20,692 |
| 2018 | $1,603 | $27,073 | $7,300 | $19,773 |
| 2017 | $1,600 | $25,212 | $6,798 | $18,414 |
| 2016 | $1,665 | $27,565 | $6,458 | $21,107 |
| 2014 | $1,534 | $27,723 | $6,495 | $21,228 |
| 2013 | $2,256 | $29,577 | $6,929 | $22,648 |
Source: Public Records
Map
Nearby Homes
- 120 Lynnhaven Dr
- 101 Sheffield Dr
- 922 S 74th St
- 860 Wilshire Dr
- 7117 Gary Dr
- 13 Chamberlain Ct
- 10 Chamberlain Ct
- 311 Chevy Chase Dr
- 245 Oliver Lee Dr
- 125 Chevy Chase Dr
- 8100 Excellence Place
- 69 Country Club Acres
- 8310 Old Saint Louis Rd
- 7304 Northern Dr
- 7522 Claymont Ct Unit 3
- 408 Southgate Dr
- 616 Oak Hill Dr
- 7426 Foley Dr
- 100 Cascade Dr
- 25 S 76th St
- 104 Sheffield Dr
- 112 Sheffield Dr
- 116 Sheffield Dr
- 100 Sheffield Dr
- 109 Sheffield Dr
- 105 Sheffield Dr
- 113 Sheffield Dr
- 120 Sheffield Dr
- 117 Sheffield Dr
- 108 Lynnhaven Dr
- 104 Lynnhaven Dr
- 112 Lynnhaven Dr
- 124 Sheffield Dr
- 121 Sheffield Dr
- 7530 Westchester Dr
- 7526 Westchester Dr
- 100 Lynnhaven Dr
- 7534 Westchester Dr
- 177 Sheffield Dr
- 7604 Woodcliffe Dr
Your Personal Tour Guide
Ask me questions while you tour the home.