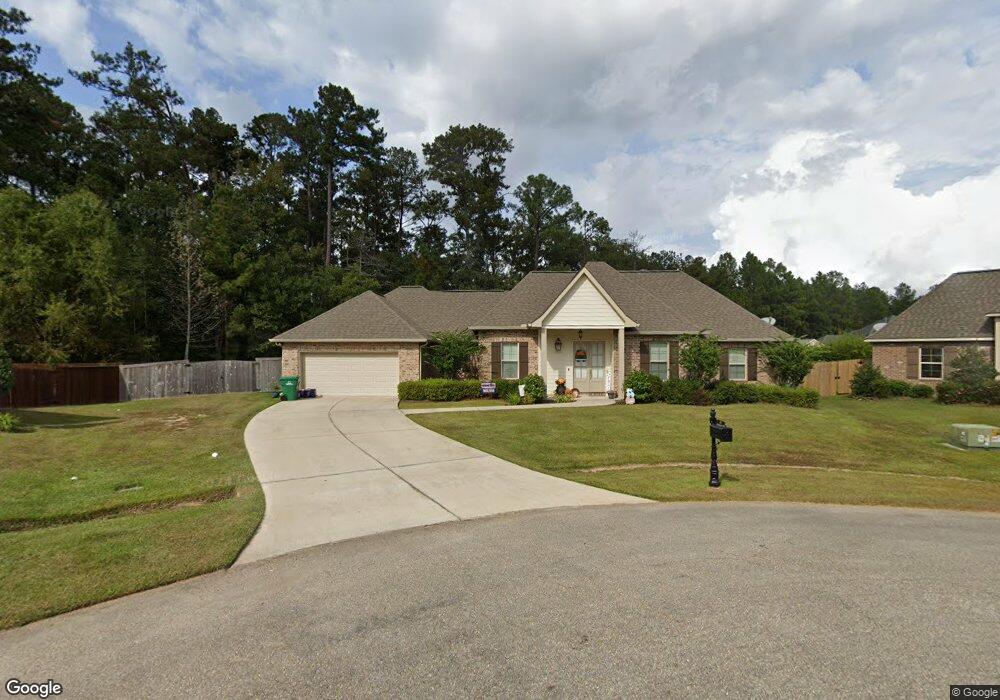
108 Sherry Ct Covington, LA 70433
Estimated Value: $361,000 - $419,000
Studio
--
Bath
1,927
Sq Ft
$198/Sq Ft
Est. Value
About This Home
This home is located at 108 Sherry Ct, Covington, LA 70433 and is currently estimated at $381,718, approximately $198 per square foot. 108 Sherry Ct is a home with nearby schools including E. E. Lyon Elementary School, Fontainebleau Junior High School, and Pine View Middle School.
Ownership History
Date
Name
Owned For
Owner Type
Purchase Details
Closed on
Jan 6, 2017
Sold by
110 Capital Pool 2 Llc
Bought by
Marengo Foster Jennifer Ferriss and Marengo Showalter Alisha
Current Estimated Value
Home Financials for this Owner
Home Financials are based on the most recent Mortgage that was taken out on this home.
Original Mortgage
$275,793
Outstanding Balance
$221,948
Interest Rate
3.75%
Mortgage Type
FHA
Estimated Equity
$159,770
Purchase Details
Closed on
Oct 17, 2012
Sold by
Diggs Marino Deborah and Marino Anthony F
Bought by
110 Capital Pool 2 Llc
Home Financials for this Owner
Home Financials are based on the most recent Mortgage that was taken out on this home.
Original Mortgage
$206,400
Interest Rate
3.55%
Mortgage Type
Commercial
Create a Home Valuation Report for This Property
The Home Valuation Report is an in-depth analysis detailing your home's value as well as a comparison with similar homes in the area
Home Values in the Area
Average Home Value in this Area
Purchase History
| Date | Buyer | Sale Price | Title Company |
|---|---|---|---|
| Marengo Foster Jennifer Ferriss | $282,000 | First American Title | |
| 110 Capital Pool 2 Llc | $153,500 | First American Title Insuran |
Source: Public Records
Mortgage History
| Date | Status | Borrower | Loan Amount |
|---|---|---|---|
| Open | Marengo Foster Jennifer Ferriss | $275,793 | |
| Previous Owner | 110 Capital Pool 2 Llc | $206,400 |
Source: Public Records
Tax History
| Year | Tax Paid | Tax Assessment Tax Assessment Total Assessment is a certain percentage of the fair market value that is determined by local assessors to be the total taxable value of land and additions on the property. | Land | Improvement |
|---|---|---|---|---|
| 2025 | $2,956 | $32,345 | $4,500 | $27,845 |
| 2024 | $2,956 | $32,345 | $4,500 | $27,845 |
| 2023 | $3,065 | $25,612 | $4,500 | $21,112 |
| 2022 | $236,997 | $25,612 | $4,500 | $21,112 |
| 2021 | $2,365 | $25,612 | $4,500 | $21,112 |
| 2020 | $2,362 | $25,612 | $4,500 | $21,112 |
| 2019 | $3,260 | $24,475 | $3,553 | $20,922 |
| 2018 | $3,282 | $24,475 | $3,553 | $20,922 |
| 2017 | $293 | $2,131 | $2,131 | $0 |
| 2016 | $294 | $2,131 | $2,131 | $0 |
| 2015 | $287 | $2,040 | $2,040 | $0 |
| 2014 | $144 | $1,030 | $1,030 | $0 |
| 2013 | -- | $1,030 | $1,030 | $0 |
Source: Public Records
Map
Nearby Homes
Your Personal Tour Guide
Ask me questions while you tour the home.