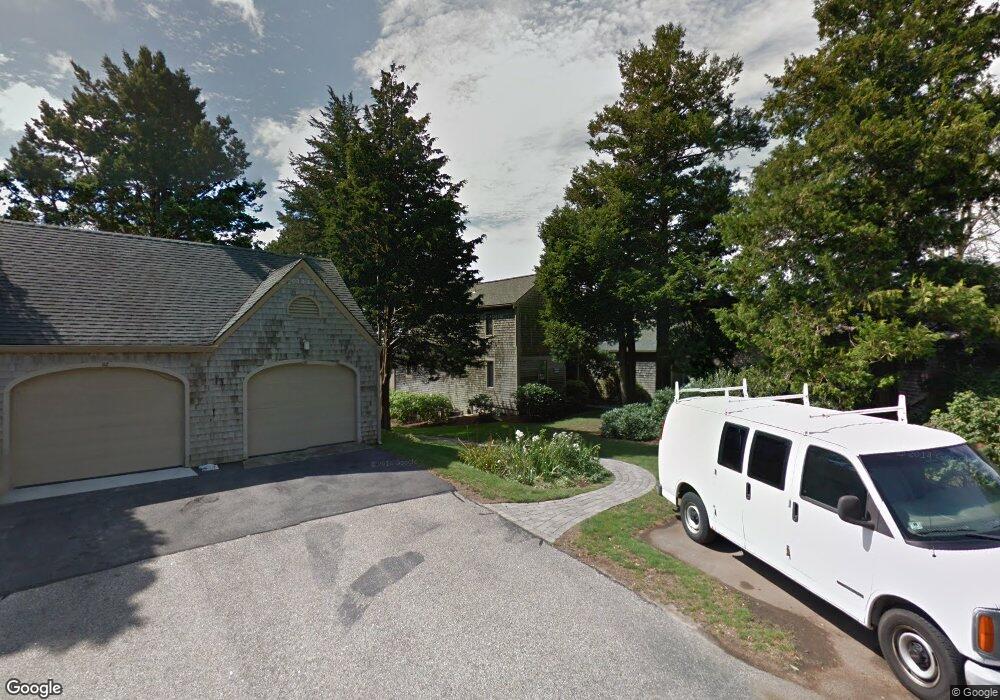
108 Ships Watch Falmouth, MA 02540
Falmouth Village NeighborhoodEstimated Value: $871,135 - $971,000
2
Beds
3
Baths
1,880
Sq Ft
$490/Sq Ft
Est. Value
About This Home
This home is located at 108 Ships Watch, Falmouth, MA 02540 and is currently estimated at $920,534, approximately $489 per square foot. 108 Ships Watch is a home located in Barnstable County with nearby schools including Mullen-Hall School, Lawrence School, and Morse Pond School.
Ownership History
Date
Name
Owned For
Owner Type
Purchase Details
Closed on
Nov 22, 2024
Sold by
Sanchez Pedro A
Bought by
Pedro Antonio Sanchez T and Pedro Sanchez-Goebel
Current Estimated Value
Purchase Details
Closed on
Oct 1, 2009
Sold by
Wright 3Rd Walter A and Wright Elizabeth Heger
Bought by
Sanchez Pedro A and Palm Cheryl A
Home Financials for this Owner
Home Financials are based on the most recent Mortgage that was taken out on this home.
Original Mortgage
$220,000
Interest Rate
5.12%
Mortgage Type
Purchase Money Mortgage
Purchase Details
Closed on
May 5, 2000
Sold by
Virginia A Estes Ret and Estes Virginia A
Bought by
Wright Walter A and Heger-Wright Elizabeth
Purchase Details
Closed on
Dec 20, 1999
Sold by
Doherty Joseph R
Bought by
Virginia A Estes Ret and Estes Virginia A
Create a Home Valuation Report for This Property
The Home Valuation Report is an in-depth analysis detailing your home's value as well as a comparison with similar homes in the area
Home Values in the Area
Average Home Value in this Area
Purchase History
| Date | Buyer | Sale Price | Title Company |
|---|---|---|---|
| Pedro Antonio Sanchez T | -- | None Available | |
| Pedro Antonio Sanchez T | -- | None Available | |
| Sanchez Pedro A | $391,000 | -- | |
| Sanchez Pedro A | $391,000 | -- | |
| Wright Walter A | $365,000 | -- | |
| Wright Walter A | $365,000 | -- | |
| Virginia A Estes Ret | $325,000 | -- | |
| Virginia A Estes Ret | $325,000 | -- |
Source: Public Records
Mortgage History
| Date | Status | Borrower | Loan Amount |
|---|---|---|---|
| Previous Owner | Sanchez Pedro A | $220,000 | |
| Previous Owner | Virginia A Estes Ret | $322,700 | |
| Previous Owner | Virginia A Estes Ret | $300,700 |
Source: Public Records
Tax History Compared to Growth
Tax History
| Year | Tax Paid | Tax Assessment Tax Assessment Total Assessment is a certain percentage of the fair market value that is determined by local assessors to be the total taxable value of land and additions on the property. | Land | Improvement |
|---|---|---|---|---|
| 2025 | $4,565 | $777,700 | $0 | $777,700 |
| 2024 | $4,233 | $674,000 | $0 | $674,000 |
| 2023 | $4,367 | $631,000 | $0 | $631,000 |
| 2022 | $4,808 | $597,300 | $0 | $597,300 |
| 2021 | $3,759 | $442,200 | $0 | $442,200 |
| 2020 | $3,798 | $442,200 | $0 | $442,200 |
| 2019 | $3,903 | $455,900 | $0 | $455,900 |
| 2018 | $3,774 | $438,800 | $0 | $438,800 |
| 2017 | $3,751 | $439,700 | $0 | $439,700 |
| 2016 | $3,804 | $454,500 | $0 | $454,500 |
| 2015 | $3,722 | $454,500 | $0 | $454,500 |
| 2014 | $3,258 | $399,700 | $0 | $399,700 |
Source: Public Records
Map
Nearby Homes
- 38 Landfall Unit 38
- 38 Landfall
- 251 Woods Hole Rd
- 87 Oyster Pond Rd
- 44 Carey Ln
- 15 Hedge Ln
- 45 Haynes Ave
- 27 Upland Ave
- 71 Main St
- 65 Walker St
- 98 Main St
- 98 Main St Unit 1
- 30 Katherine Lee Bates Rd
- 33 Oakwood Ave
- 76 F r Lillie Rd
- 29 Wilson Rd
- 480 Main St Unit 1
- 10 Shanks Pond Rd
- 110 Dillingham Ave Unit 322
- 253 Scranton Ave
- 102 Ships Watch
- 104 Ships Watch
- 106 Ships Watch
- 102 Ships Watch Unit 102
- 106 Ships Watch Unit 132
- 102 Ships Watch Unit 134
- 108 Ships Watch Unit 13-4
- 104 Ships Watch Unit 13-3
- 118 Ships Watch
- 124 Ships Watch
- 94 Ships Watch
- 84 Ships Watch
- 92 Ships Watch
- 70 Landfall
- 14 Landfall
- 10 Landfall
- 10 Landfall Unit 10
- 14 Landfall Treetops Unit U-14
- 10 Landfall Unit 2-1
- 110 Ships Watch