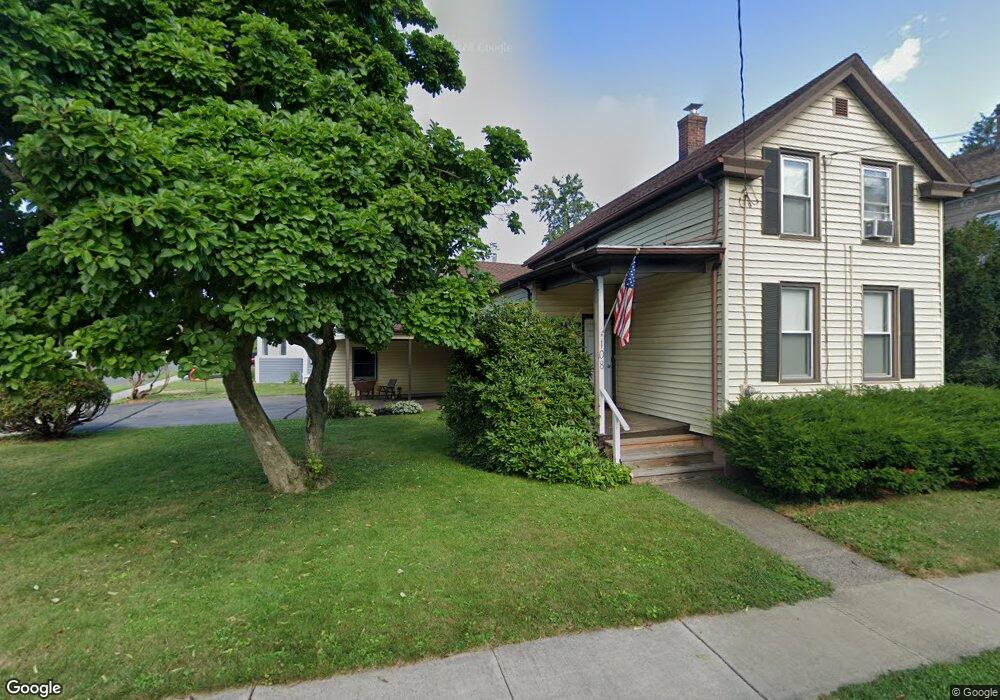
108 Spring St Windsor, CT 06095
Estimated Value: $312,000 - $342,000
3
Beds
2
Baths
1,390
Sq Ft
$234/Sq Ft
Est. Value
About This Home
This home is located at 108 Spring St, Windsor, CT 06095 and is currently estimated at $325,474, approximately $234 per square foot. 108 Spring St is a home located in Hartford County with nearby schools including Oliver Ellsworth School, John F. Kennedy School, and Sage Park Middle School.
Ownership History
Date
Name
Owned For
Owner Type
Purchase Details
Closed on
Jun 29, 2007
Sold by
Ernst Virginia
Bought by
Worry Michael
Current Estimated Value
Purchase Details
Closed on
Feb 23, 2004
Sold by
Capuano Jay Est and Capuano
Bought by
Ernst Virginia
Purchase Details
Closed on
Jan 15, 1997
Sold by
Bateman Thomas and Bateman Berry
Bought by
Ernst Virginia
Purchase Details
Closed on
Mar 18, 1994
Sold by
Mock Peggy
Bought by
Bateman Thomas and Bateman Berry
Create a Home Valuation Report for This Property
The Home Valuation Report is an in-depth analysis detailing your home's value as well as a comparison with similar homes in the area
Home Values in the Area
Average Home Value in this Area
Purchase History
| Date | Buyer | Sale Price | Title Company |
|---|---|---|---|
| Worry Michael | $217,000 | -- | |
| Ernst Virginia | $175,000 | -- | |
| Ernst Virginia | $88,500 | -- | |
| Bateman Thomas | $102,000 | -- |
Source: Public Records
Mortgage History
| Date | Status | Borrower | Loan Amount |
|---|---|---|---|
| Open | Bateman Thomas | $172,900 | |
| Closed | Bateman Thomas | $186,683 |
Source: Public Records
Tax History
| Year | Tax Paid | Tax Assessment Tax Assessment Total Assessment is a certain percentage of the fair market value that is determined by local assessors to be the total taxable value of land and additions on the property. | Land | Improvement |
|---|---|---|---|---|
| 2025 | $5,087 | $171,290 | $52,360 | $118,930 |
| 2024 | $5,450 | $171,290 | $52,360 | $118,930 |
| 2023 | $3,998 | $113,890 | $42,770 | $71,120 |
| 2022 | $3,960 | $113,890 | $42,770 | $71,120 |
| 2021 | $3,988 | $113,890 | $42,770 | $71,120 |
| 2020 | $3,942 | $113,890 | $42,770 | $71,120 |
| 2019 | $3,859 | $113,890 | $42,770 | $71,120 |
| 2018 | $3,791 | $108,430 | $42,770 | $65,660 |
| 2017 | $3,519 | $108,430 | $42,770 | $65,660 |
| 2016 | $3,418 | $108,430 | $42,770 | $65,660 |
| 2015 | $3,353 | $108,430 | $42,770 | $65,660 |
| 2014 | $3,304 | $108,430 | $42,770 | $65,660 |
Source: Public Records
Map
Nearby Homes
Your Personal Tour Guide
Ask me questions while you tour the home.