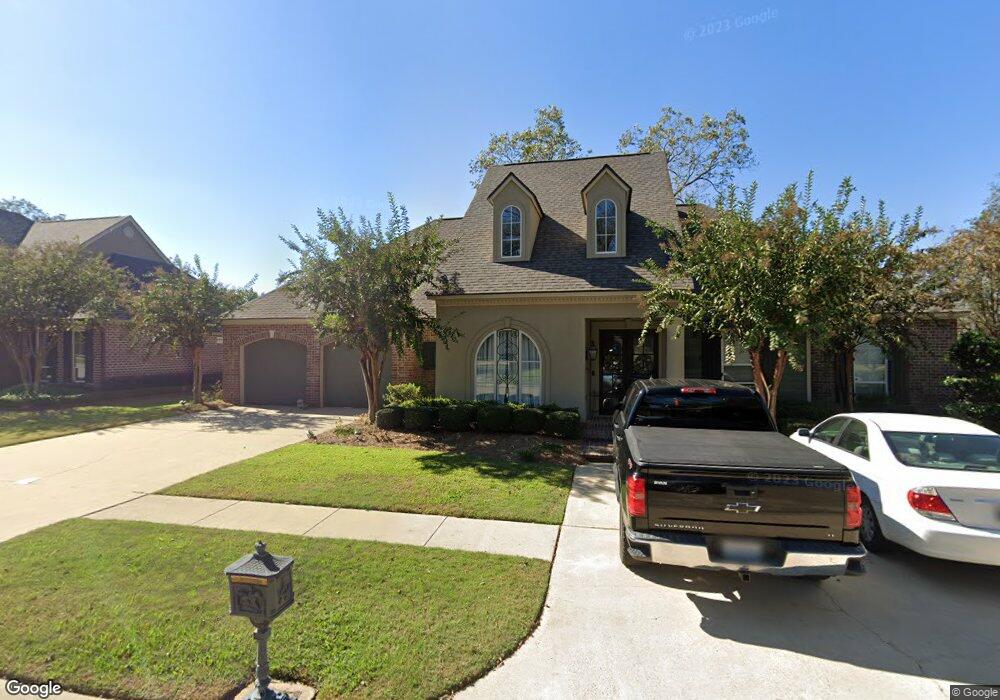
108 St Charles Cir Monroe, LA 71201
North Monroe NeighborhoodEstimated Value: $484,000 - $574,000
4
Beds
5
Baths
4,525
Sq Ft
$112/Sq Ft
Est. Value
About This Home
This home is located at 108 St Charles Cir, Monroe, LA 71201 and is currently estimated at $508,442, approximately $112 per square foot. 108 St Charles Cir is a home located in Ouachita Parish with nearby schools including Sterlington Elementary School, Sterlington High School, and Ouachita Christian School.
Ownership History
Date
Name
Owned For
Owner Type
Purchase Details
Closed on
Oct 30, 2017
Sold by
Wade Robert Russell and Futch Wade Christa Lynn
Bought by
Bentley Christopher Ethridge and Bentley Leigh Farrar
Current Estimated Value
Home Financials for this Owner
Home Financials are based on the most recent Mortgage that was taken out on this home.
Original Mortgage
$337,250
Outstanding Balance
$281,774
Interest Rate
3.83%
Mortgage Type
New Conventional
Estimated Equity
$226,668
Purchase Details
Closed on
Apr 23, 2008
Sold by
Johnson Brian Bishop
Bought by
Oswalt Thomas J
Purchase Details
Closed on
Jun 2, 2006
Sold by
B E Rice Construction Company Inc
Bought by
Johnson Brian Bishop
Home Financials for this Owner
Home Financials are based on the most recent Mortgage that was taken out on this home.
Original Mortgage
$332,550
Interest Rate
6.56%
Mortgage Type
Purchase Money Mortgage
Create a Home Valuation Report for This Property
The Home Valuation Report is an in-depth analysis detailing your home's value as well as a comparison with similar homes in the area
Home Values in the Area
Average Home Value in this Area
Purchase History
| Date | Buyer | Sale Price | Title Company |
|---|---|---|---|
| Bentley Christopher Ethridge | $355,000 | North Delta Title | |
| Oswalt Thomas J | $426,750 | None Available | |
| Johnson Brian Bishop | $369,500 | None Available |
Source: Public Records
Mortgage History
| Date | Status | Borrower | Loan Amount |
|---|---|---|---|
| Open | Bentley Christopher Ethridge | $337,250 | |
| Previous Owner | Johnson Brian Bishop | $332,550 |
Source: Public Records
Tax History Compared to Growth
Tax History
| Year | Tax Paid | Tax Assessment Tax Assessment Total Assessment is a certain percentage of the fair market value that is determined by local assessors to be the total taxable value of land and additions on the property. | Land | Improvement |
|---|---|---|---|---|
| 2024 | $4,807 | $41,973 | $6,000 | $35,973 |
| 2023 | $4,807 | $38,055 | $6,000 | $32,055 |
| 2022 | $5,208 | $38,055 | $6,000 | $32,055 |
| 2021 | $5,250 | $38,055 | $6,000 | $32,055 |
| 2020 | $5,250 | $38,055 | $6,000 | $32,055 |
| 2019 | $5,112 | $37,580 | $6,000 | $31,580 |
| 2018 | $3,912 | $37,580 | $6,000 | $31,580 |
| 2017 | $5,007 | $37,580 | $6,000 | $31,580 |
| 2016 | $4,885 | $37,580 | $6,000 | $31,580 |
| 2015 | $3,905 | $37,580 | $6,000 | $31,580 |
| 2014 | $3,905 | $37,580 | $6,000 | $31,580 |
| 2013 | $3,895 | $37,580 | $6,000 | $31,580 |
Source: Public Records
Map
Nearby Homes
- 117 Saint Charles Cir
- 115 Saint Charles Cir
- 127 St Charles Cir
- 0 Waters Edge Dr
- 8 Angelina Ln
- 7201 Egret Landing
- 7203 Egret Landing
- 405 Bent Willow Loop
- 407 Bent Willow Loop
- 409 Bent Willow Loop
- 415 Bent Willow Loop
- 417 Bent Willow Loop
- 419 Bent Willow Loop
- 511 Buck Loop
- 509 Buck Loop
- 503 Buck Loop
- 501 Buck Loop
- 413 Buck Loop
- 411 Buck Loop
- 409 Buck Loop
- 108 Saint Charles Cir
- 108 St Charles Cir
- 106 Saint Charles Cir
- 110 Saint Charles Cir
- 124 Saint Charles Cir
- 122 Saint Charles Cir
- 126 Saint Charles Cir
- 122 St Charles Cir
- 107 Saint Charles Cir
- 111 St Charles Cir
- 128 Saint Charles Cir
- 111 Saint Charles Cir
- 105 St Charles Cir
- 105 Saint Charles Cir
- 102 Saint Charles Cir
- 102 St Charles Cir
- 125 St Charles Cir
- 125 Saint Charles Cir
- 113 Saint Charles Cir
- 132 St Charles Cir