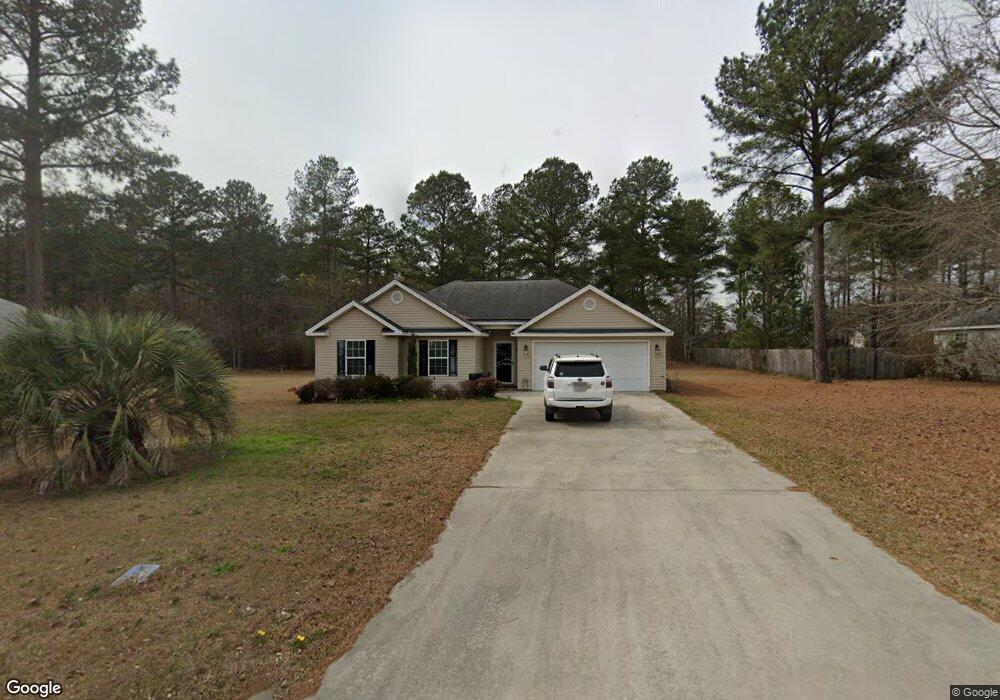
108 Stonebrook Way Statesboro, GA 30458
Estimated Value: $235,935 - $266,000
3
Beds
2
Baths
1,150
Sq Ft
$216/Sq Ft
Est. Value
About This Home
This home is located at 108 Stonebrook Way, Statesboro, GA 30458 and is currently estimated at $248,484, approximately $216 per square foot. 108 Stonebrook Way is a home located in Bulloch County with nearby schools including Southeast Bulloch High School, Nevils Elementary School, and Southeast Bulloch Middle School.
Ownership History
Date
Name
Owned For
Owner Type
Purchase Details
Closed on
Oct 1, 2013
Sold by
Hadley Donald R
Bought by
Hadley Donald R and Rogers Penny C
Current Estimated Value
Home Financials for this Owner
Home Financials are based on the most recent Mortgage that was taken out on this home.
Original Mortgage
$107,417
Outstanding Balance
$79,925
Interest Rate
4.25%
Mortgage Type
FHA
Estimated Equity
$168,559
Purchase Details
Closed on
Sep 26, 2008
Sold by
Not Provided
Bought by
Hadley Rogers Penny C and Hadley Donald R
Home Financials for this Owner
Home Financials are based on the most recent Mortgage that was taken out on this home.
Original Mortgage
$116,986
Interest Rate
6.36%
Mortgage Type
New Conventional
Purchase Details
Closed on
Mar 15, 2007
Sold by
Not Provided
Bought by
Hadley Rogers Penny C and Hadley Donald R
Create a Home Valuation Report for This Property
The Home Valuation Report is an in-depth analysis detailing your home's value as well as a comparison with similar homes in the area
Home Values in the Area
Average Home Value in this Area
Purchase History
| Date | Buyer | Sale Price | Title Company |
|---|---|---|---|
| Hadley Donald R | -- | -- | |
| Hadley Rogers Penny C | $120,450 | -- | |
| Hadley Rogers Penny C | $600,000 | -- |
Source: Public Records
Mortgage History
| Date | Status | Borrower | Loan Amount |
|---|---|---|---|
| Open | Hadley Donald R | $107,417 | |
| Previous Owner | Hadley Rogers Penny C | $116,986 |
Source: Public Records
Tax History Compared to Growth
Tax History
| Year | Tax Paid | Tax Assessment Tax Assessment Total Assessment is a certain percentage of the fair market value that is determined by local assessors to be the total taxable value of land and additions on the property. | Land | Improvement |
|---|---|---|---|---|
| 2024 | $1,770 | $79,440 | $20,000 | $59,440 |
| 2023 | $1,754 | $72,520 | $14,000 | $58,520 |
| 2022 | $1,275 | $57,679 | $9,840 | $47,839 |
| 2021 | $1,174 | $52,080 | $9,840 | $42,240 |
| 2020 | $1,122 | $49,053 | $9,840 | $39,213 |
| 2019 | $1,049 | $45,672 | $10,800 | $34,872 |
| 2018 | $1,081 | $45,422 | $10,800 | $34,622 |
| 2017 | $1,060 | $44,048 | $10,800 | $33,248 |
| 2016 | $1,100 | $42,658 | $10,800 | $31,858 |
| 2015 | $1,085 | $41,817 | $10,800 | $31,017 |
| 2014 | $1,005 | $41,817 | $10,800 | $31,017 |
Source: Public Records
Map
Nearby Homes
- 512 Colquitt Ln
- 412 Mayberry Way
- 310 Barney Run Unit 173
- 206 Aunt Bee Blvd
- 202 Aunt Bee Blvd
- 208 Aunt Bee Blvd
- 258 Stonebrook Way
- 171 Stonebrook Way
- 149 Griffith Ln
- 205 Sawtooth Ct
- 126 Enclave Ct Unit LOT 19
- 118 Enclave Ct Unit LOT 21
- 122 Enclave Ct Unit LOT 20
- 112 Enclave Ct Unit LOT 24
- 110 Enclave Ct Unit LOT 25
- 108 Enclave Ct Unit LOT 26
- 310 Parkersburg Ln Unit 50
- 208 Hopecrest Rd Unit 63
- 209 Hopecrest Rd
- 210 Hopecrest Rd Unit 62
- 106 Stonebrook Way
- 110 Stonebrook Way
- 112 Stonebrook Way
- 104 Stonebrook Way
- 104 Stonebrook Way Unit 3
- 101 Stonebrook Way
- 111 Stonebrook Way
- 109 Stonebrook Way
- 107 Stonebrook Way Unit 111
- 107 Stonebrook Way
- 114 Stonebrook Way
- 102 Stonebrook Way
- 0 Stonebrook Unit LOT 78 3132044
- 0 Stonebrook Unit LOT 80 3146498
- 0 Stonebrook Unit LOT 100 3255232
- 0 Stonebrook Unit LOT 98 3255231
- 0 Stonebrook Unit LOT 46 3254455
- 0 Stonebrook Unit LOT 32 3254453
- 0 Stonebrook Unit LOT 118 3261700
- 0 Stonebrook Unit 96 7056844