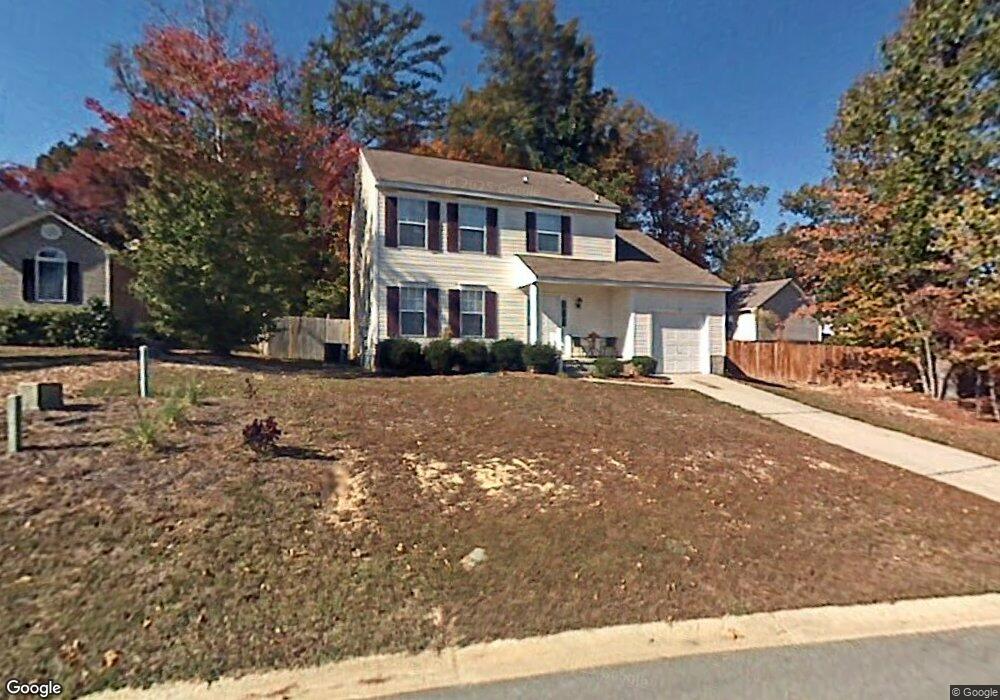
108 Stoney Pointe Dr Chapin, SC 29036
Estimated Value: $255,000 - $305,000
3
Beds
3
Baths
1,674
Sq Ft
$164/Sq Ft
Est. Value
About This Home
This home is located at 108 Stoney Pointe Dr, Chapin, SC 29036 and is currently estimated at $273,991, approximately $163 per square foot. 108 Stoney Pointe Dr is a home located in Lexington County with nearby schools including Chapin Elementary School, Chapin Intermediate, and Chapin High School.
Ownership History
Date
Name
Owned For
Owner Type
Purchase Details
Closed on
Apr 17, 2023
Sold by
Elswick Allison M and Moore Allison Renee
Bought by
Mcgee Heather R and Mcgee Cody C
Current Estimated Value
Home Financials for this Owner
Home Financials are based on the most recent Mortgage that was taken out on this home.
Original Mortgage
$229,751
Outstanding Balance
$222,227
Interest Rate
6.65%
Mortgage Type
New Conventional
Estimated Equity
$51,764
Purchase Details
Closed on
Aug 30, 2007
Sold by
Bono Michael
Bought by
Moore Allison Renee and Elswick Randall M
Home Financials for this Owner
Home Financials are based on the most recent Mortgage that was taken out on this home.
Original Mortgage
$130,000
Interest Rate
6.65%
Mortgage Type
Purchase Money Mortgage
Purchase Details
Closed on
Jun 27, 2001
Sold by
Marc Homebuilders Inc
Bought by
Bono Michael
Purchase Details
Closed on
Jan 31, 2001
Sold by
Five Star Development Corp
Bought by
Marc Homebuilders Inc
Create a Home Valuation Report for This Property
The Home Valuation Report is an in-depth analysis detailing your home's value as well as a comparison with similar homes in the area
Home Values in the Area
Average Home Value in this Area
Purchase History
| Date | Buyer | Sale Price | Title Company |
|---|---|---|---|
| Mcgee Heather R | $239,000 | None Listed On Document | |
| Moore Allison Renee | $130,000 | None Available | |
| Bono Michael | $106,758 | -- | |
| Marc Homebuilders Inc | $180,000 | -- |
Source: Public Records
Mortgage History
| Date | Status | Borrower | Loan Amount |
|---|---|---|---|
| Open | Mcgee Heather R | $229,751 | |
| Previous Owner | Moore Allison Renee | $130,000 |
Source: Public Records
Tax History
| Year | Tax Paid | Tax Assessment Tax Assessment Total Assessment is a certain percentage of the fair market value that is determined by local assessors to be the total taxable value of land and additions on the property. | Land | Improvement |
|---|---|---|---|---|
| 2024 | $1,381 | $9,560 | $1,252 | $8,308 |
| 2023 | $1,463 | $5,047 | $1,077 | $3,970 |
| 2020 | $816 | $5,047 | $1,077 | $3,970 |
| 2019 | $722 | $4,389 | $1,000 | $3,389 |
| 2018 | $636 | $4,389 | $1,000 | $3,389 |
| 2017 | $619 | $4,389 | $1,000 | $3,389 |
| 2016 | $635 | $4,389 | $1,000 | $3,389 |
| 2014 | $693 | $4,814 | $1,000 | $3,814 |
| 2013 | -- | $4,810 | $1,000 | $3,810 |
Source: Public Records
Map
Nearby Homes
- 106 Shipyard Blvd
- 141 Palm St
- 212 Walkbridge Way
- 180 Palm St
- 192 Palm St
- 0 Dreher Island Rd Unit 21647709
- 0 Dreher Island Rd Unit 587193
- 188 Kerry Gibbons Dr
- 409 Dutchman Shores Cir
- 147 Ventnor Ave
- 151 Ventnor Ave
- 108 Pennsylvania Ct
- 1168 Old Bush River Rd
- 229 Dutchman Shores Cir
- 524 Murray Lindler Rd
- 190 Elm Creek Dr
- 125 Northshore Dr
- 540 Lakeshore Dr
- 171 Elm Creek Dr
- 392 Eagle Pointe Dr
- 112 Stoney Pointe Dr
- 311 Cutter Ct
- 309 Cutter Ct
- 116 Stoney Pointe Dr
- 313 Cutter Ct
- 111 Stoney Pointe Dr
- 111 Stoney Point Dr
- 305 Cutter Ct
- 265 Stoney Pointe Dr
- 140 Shipyard Blvd
- 261 Stoney Pointe Dr
- 99 Stoney Pointe Dr
- 316 Cutter Ct
- 119 Stoney Point Dr
- 257 Stoney Pointe Dr
- 95 Stoney Pointe Dr
- 123 Stoney Pointe Dr
- 308 Cutter Ct
- 312 Cutter Ct
- 124 Stoney Pointe Dr
Your Personal Tour Guide
Ask me questions while you tour the home.