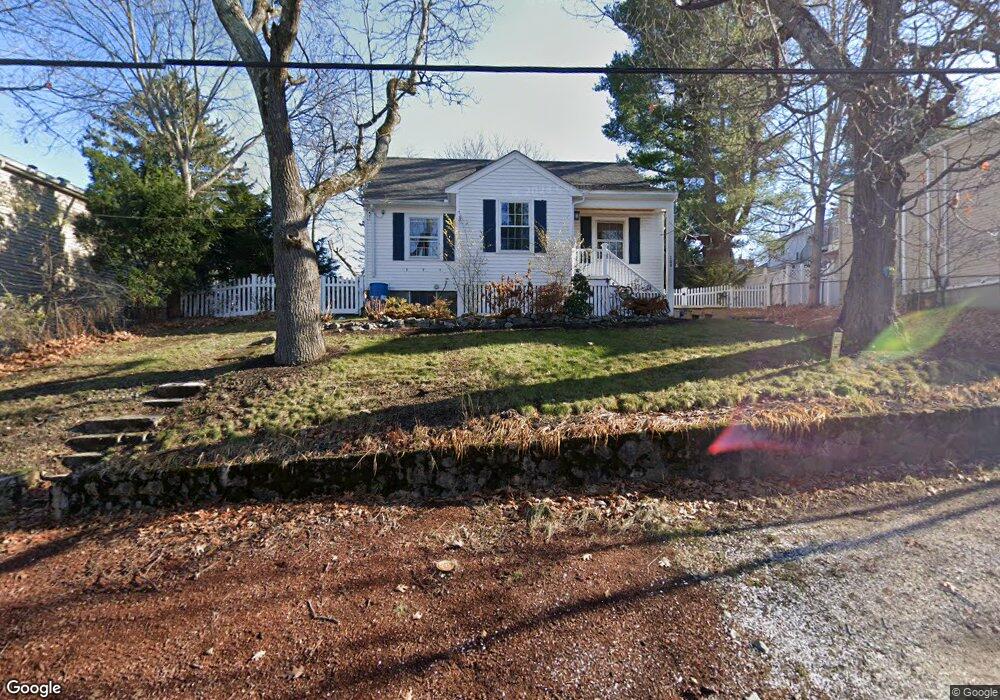
108 Sylvia St Arlington, MA 02476
Arlington Heights NeighborhoodEstimated Value: $706,000 - $1,050,218
3
Beds
2
Baths
1,728
Sq Ft
$535/Sq Ft
Est. Value
About This Home
This home is located at 108 Sylvia St, Arlington, MA 02476 and is currently estimated at $924,805, approximately $535 per square foot. 108 Sylvia St is a home located in Middlesex County with nearby schools including Dallin Elementary School, Ottoson Middle School, and Arlington High School.
Ownership History
Date
Name
Owned For
Owner Type
Purchase Details
Closed on
Jul 11, 2024
Sold by
Steeves David M and Wasserman Amy R
Bought by
Steeves D and Steeves Wasserman A
Current Estimated Value
Purchase Details
Closed on
Dec 30, 2013
Sold by
Wasserman Amy R
Bought by
Wasserman Amy R and Steeves David M
Home Financials for this Owner
Home Financials are based on the most recent Mortgage that was taken out on this home.
Original Mortgage
$298,000
Interest Rate
4.35%
Mortgage Type
New Conventional
Purchase Details
Closed on
Jul 15, 2010
Sold by
Wasserman Amy R and Dietz Stephen C
Bought by
Dietz Amy R
Home Financials for this Owner
Home Financials are based on the most recent Mortgage that was taken out on this home.
Original Mortgage
$312,000
Interest Rate
4.82%
Mortgage Type
Purchase Money Mortgage
Purchase Details
Closed on
Apr 29, 1994
Sold by
Est Johnson Ethel P and Johnston Warren H
Bought by
Stone Gregory E and Stone Victoria
Create a Home Valuation Report for This Property
The Home Valuation Report is an in-depth analysis detailing your home's value as well as a comparison with similar homes in the area
Home Values in the Area
Average Home Value in this Area
Purchase History
| Date | Buyer | Sale Price | Title Company |
|---|---|---|---|
| Steeves D | -- | None Available | |
| Steeves D | -- | None Available | |
| Wasserman Amy R | -- | -- | |
| Wasserman Amy R | -- | -- | |
| Dietz Amy R | -- | -- | |
| Dietz Amy R | -- | -- | |
| Stone Gregory E | $159,800 | -- | |
| Wasserman Amy R | -- | -- | |
| Dietz Amy R | -- | -- | |
| Stone Gregory E | $159,800 | -- |
Source: Public Records
Mortgage History
| Date | Status | Borrower | Loan Amount |
|---|---|---|---|
| Previous Owner | Wasserman Amy R | $298,000 | |
| Previous Owner | Dietz Amy R | $312,000 |
Source: Public Records
Tax History Compared to Growth
Tax History
| Year | Tax Paid | Tax Assessment Tax Assessment Total Assessment is a certain percentage of the fair market value that is determined by local assessors to be the total taxable value of land and additions on the property. | Land | Improvement |
|---|---|---|---|---|
| 2025 | $9,517 | $883,700 | $508,800 | $374,900 |
| 2024 | $8,805 | $831,400 | $489,700 | $341,700 |
| 2023 | $8,381 | $747,600 | $457,900 | $289,700 |
| 2022 | $8,242 | $721,700 | $445,200 | $276,500 |
| 2021 | $7,721 | $680,900 | $445,200 | $235,700 |
| 2020 | $7,531 | $680,900 | $445,200 | $235,700 |
| 2019 | $7,287 | $647,200 | $438,800 | $208,400 |
| 2018 | $6,488 | $534,900 | $337,100 | $197,800 |
| 2017 | $6,478 | $515,800 | $318,000 | $197,800 |
| 2016 | $6,277 | $490,400 | $292,600 | $197,800 |
| 2015 | $6,219 | $459,000 | $273,500 | $185,500 |
Source: Public Records
Map
Nearby Homes
- 107 Hibbert St
- 64 Browning Rd
- 19 Wilbur Ave
- 56 Valentine Rd
- 10 Colonial Village Dr Unit 2
- 475 Massachusetts Ave Unit B
- 58 Westminster Ave Unit 58
- 181 Lowell St
- 70 Birch Hill Rd
- 14 Park Avenue Extension
- 51 Lowell St
- 6 Linc Cole Ln
- 1 Watermill Place Unit 304
- 1 Watermill Place Unit 308
- 11 Lowell St Unit B
- 37 Fountain Rd Unit 2
- 37 Fountain Rd
- 6 Appleton Place
- 0 Reed St
- 53 Crestview Rd
- 98 Sylvia St Unit 100
- 100 Sylvia St Unit 100
- 116 Sylvia St
- 94 Sylvia St
- 111 Hibbert St
- 103 Hibbert St
- 122 Sylvia St
- 105 Sylvia St
- 115 Hibbert St
- 99 Hibbert St
- 90 Sylvia St Unit 92
- 113 Sylvia St
- 99 Sylvia St
- 92 Sylvia St Unit 2
- 95 Hibbert St
- 97 Sylvia St
- 97 Sylvia St Unit 2
- 97 Sylvia St Unit 1
- 86 Sylvia St Unit 88
- 88 Sylvia St