Estimated Value: $224,000 - $259,000
3
Beds
2
Baths
1,361
Sq Ft
$180/Sq Ft
Est. Value
About This Home
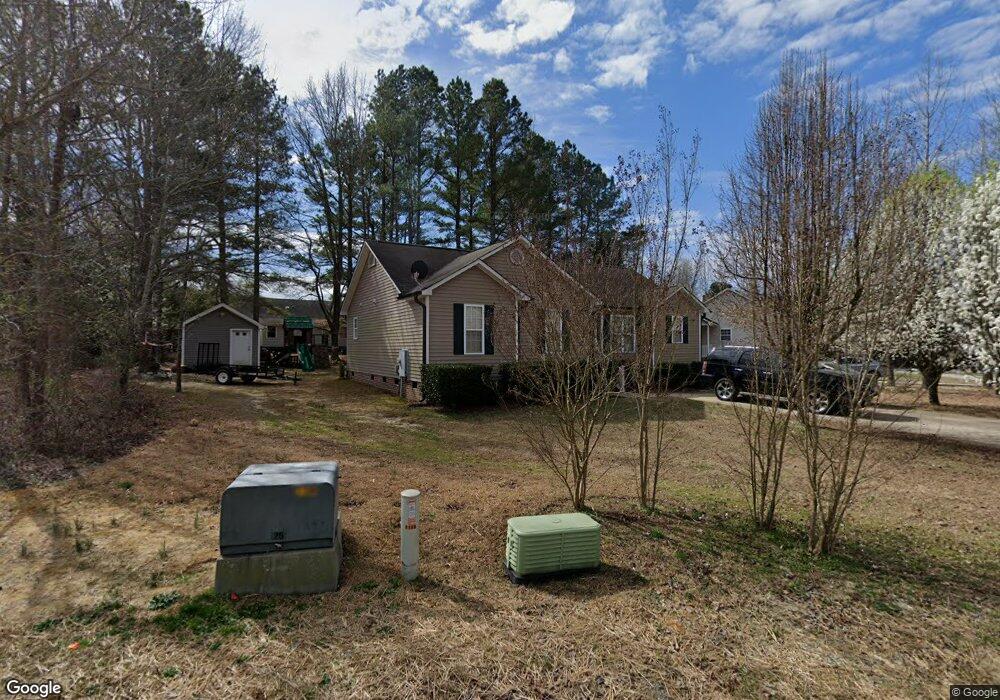
This home is located at 108 Thompson Dr, Selma, NC 27576 and is currently estimated at $244,963, approximately $179 per square foot. 108 Thompson Dr is a home located in Johnston County with nearby schools including Selma Elementary School, Selma Middle School, and Smithfield-Selma High School.
Ownership History
Date
Name
Owned For
Owner Type
Purchase Details
Closed on
May 18, 2015
Sold by
The Bank Of New York Mellon
Bought by
Camacho Valadez Jean Carlo Noe
Current Estimated Value
Home Financials for this Owner
Home Financials are based on the most recent Mortgage that was taken out on this home.
Original Mortgage
$86,406
Outstanding Balance
$66,781
Interest Rate
3.77%
Mortgage Type
FHA
Estimated Equity
$178,182
Purchase Details
Closed on
Feb 24, 2015
Sold by
Green Jennifer L
Bought by
The Bank Of New York Mellon and The Bank Of New York
Purchase Details
Closed on
Apr 28, 2006
Sold by
Comfort Homes Inc
Bought by
Dublin Rosa Oneal
Home Financials for this Owner
Home Financials are based on the most recent Mortgage that was taken out on this home.
Original Mortgage
$89,910
Interest Rate
9.64%
Mortgage Type
New Conventional
Purchase Details
Closed on
Oct 28, 2002
Sold by
A Z Thompson Family Est Trust
Bought by
A Z Thompson Family Est Trust
Create a Home Valuation Report for This Property
The Home Valuation Report is an in-depth analysis detailing your home's value as well as a comparison with similar homes in the area
Home Values in the Area
Average Home Value in this Area
Purchase History
| Date | Buyer | Sale Price | Title Company |
|---|---|---|---|
| Camacho Valadez Jean Carlo Noe | $88,000 | None Available | |
| The Bank Of New York Mellon | $76,864 | None Available | |
| Dublin Rosa Oneal | $100,000 | None Available | |
| A Z Thompson Family Est Trust | -- | -- |
Source: Public Records
Mortgage History
| Date | Status | Borrower | Loan Amount |
|---|---|---|---|
| Open | Camacho Valadez Jean Carlo Noe | $86,406 | |
| Previous Owner | Dublin Rosa Oneal | $89,910 |
Source: Public Records
Tax History
| Year | Tax Paid | Tax Assessment Tax Assessment Total Assessment is a certain percentage of the fair market value that is determined by local assessors to be the total taxable value of land and additions on the property. | Land | Improvement |
|---|---|---|---|---|
| 2025 | $2,748 | $245,390 | $45,000 | $200,390 |
| 2024 | $1,598 | $125,850 | $20,000 | $105,850 |
| 2023 | $1,534 | $118,940 | $20,000 | $98,940 |
| 2022 | $1,582 | $118,940 | $20,000 | $98,940 |
| 2021 | $1,558 | $118,940 | $20,000 | $98,940 |
| 2020 | $1,582 | $118,940 | $20,000 | $98,940 |
| 2019 | $1,546 | $118,940 | $20,000 | $98,940 |
| 2018 | $1,464 | $110,920 | $20,000 | $90,920 |
| 2017 | $1,431 | $110,920 | $20,000 | $90,920 |
| 2016 | $1,431 | $110,920 | $20,000 | $90,920 |
| 2015 | $1,431 | $110,920 | $20,000 | $90,920 |
| 2014 | $1,431 | $110,920 | $20,000 | $90,920 |
Source: Public Records
Map
Nearby Homes
- 112 Boykin Ave
- 805 River Rd
- 100 Reebe Cir
- 601 W Walnut St
- 301 N Brevard St
- 903 W Anderson St Unit 1/2
- 206 S Ethel St
- 208 S Ethel St
- 00 S Ethel St
- 807 N Pollock St
- 313 S Ethel St
- 1029 N Carolina 39 Hwy
- 62 W Victoria Ridge Dr W Unit 19
- 0 Atkinson Mill Rd Unit 10022797
- 406 N Webb St
- 183 Noramac Ct
- 0 N Webb St Unit 749891
- 208 S Webb St
- 208 N Sellers St
- 406 E Waddell St Unit B
- 112 Thompson Dr
- 116 Thompson Dr
- 114 Thompson Dr
- 118 Thompson Dr
- 106 Thompson Dr
- 110 Thompson Dr
- 106 Winter Ct
- 100 Eubank Ct
- 100 Eubanks Ct
- 104 Thompson Dr
- 104 Winter Ct
- 102 Eubank Ct
- 105 Thompson Dr
- 112 Thompson Dr
- 102 Eubanks Ct
- 115 Thompson Dr
- 103 Eubank Ct
- 102 Thompson Dr
- 105 Winter Ct
- 103 Eubanks Ct
Your Personal Tour Guide
Ask me questions while you tour the home.