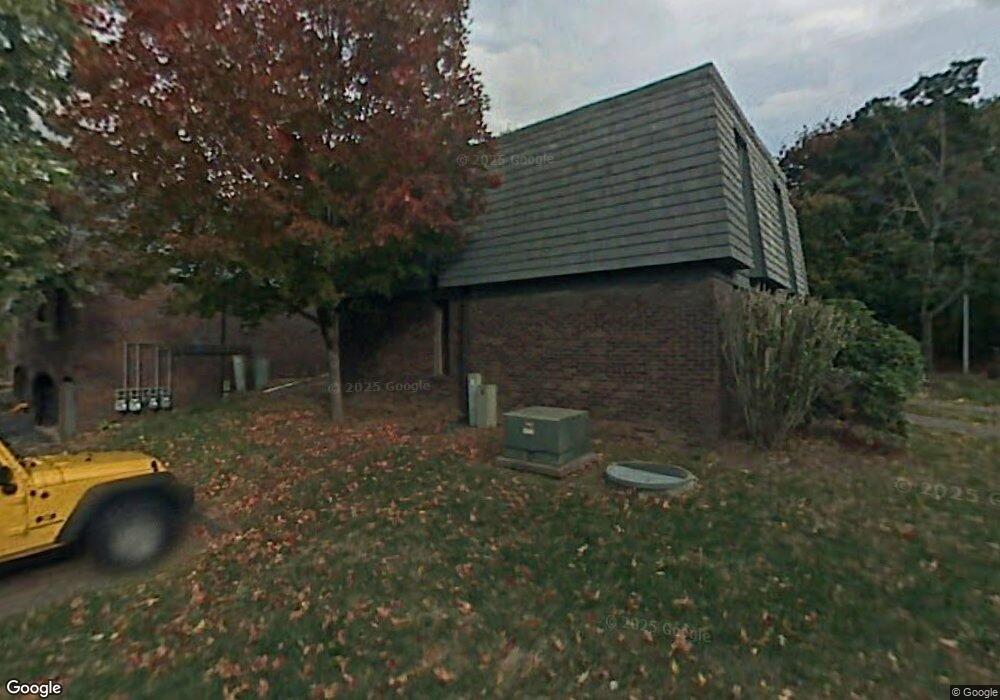
108 Trolley Crossing Ln Middletown, CT 06457
Westfield NeighborhoodEstimated Value: $126,000 - $147,000
1
Bed
1
Bath
656
Sq Ft
$208/Sq Ft
Est. Value
About This Home
This home is located at 108 Trolley Crossing Ln, Middletown, CT 06457 and is currently estimated at $136,401, approximately $207 per square foot. 108 Trolley Crossing Ln is a home located in Middlesex County with nearby schools including The Lawrence School and Middletown High School.
Ownership History
Date
Name
Owned For
Owner Type
Purchase Details
Closed on
Jan 17, 2022
Sold by
Leiss Benjamin
Bought by
Dobrindt Kevin
Current Estimated Value
Purchase Details
Closed on
Jun 25, 2020
Sold by
Halla Max
Bought by
Leiss Benjamin
Home Financials for this Owner
Home Financials are based on the most recent Mortgage that was taken out on this home.
Original Mortgage
$72,750
Interest Rate
3.2%
Mortgage Type
Purchase Money Mortgage
Purchase Details
Closed on
Jul 28, 2014
Sold by
Dubois Tamara
Bought by
Halla Max
Home Financials for this Owner
Home Financials are based on the most recent Mortgage that was taken out on this home.
Original Mortgage
$80,750
Interest Rate
4.18%
Purchase Details
Closed on
May 8, 2003
Sold by
Tisdale John C
Bought by
Dubois Tamara
Home Financials for this Owner
Home Financials are based on the most recent Mortgage that was taken out on this home.
Original Mortgage
$65,900
Interest Rate
5.93%
Create a Home Valuation Report for This Property
The Home Valuation Report is an in-depth analysis detailing your home's value as well as a comparison with similar homes in the area
Home Values in the Area
Average Home Value in this Area
Purchase History
| Date | Buyer | Sale Price | Title Company |
|---|---|---|---|
| Dobrindt Kevin | $84,900 | None Available | |
| Leiss Benjamin | $77,500 | None Available | |
| Halla Max | $85,000 | -- | |
| Dubois Tamara | $68,000 | -- |
Source: Public Records
Mortgage History
| Date | Status | Borrower | Loan Amount |
|---|---|---|---|
| Previous Owner | Leiss Benjamin | $72,750 | |
| Previous Owner | Halla Max | $80,750 | |
| Previous Owner | Dubois Tamara | $18,800 | |
| Previous Owner | Dubois Tamara | $20,000 | |
| Previous Owner | Dubois Tamara | $10,337 | |
| Previous Owner | Dubois Tamara | $65,900 |
Source: Public Records
Tax History Compared to Growth
Tax History
| Year | Tax Paid | Tax Assessment Tax Assessment Total Assessment is a certain percentage of the fair market value that is determined by local assessors to be the total taxable value of land and additions on the property. | Land | Improvement |
|---|---|---|---|---|
| 2025 | $2,272 | $67,440 | $0 | $67,440 |
| 2024 | $2,154 | $67,440 | $0 | $67,440 |
| 2023 | $2,026 | $67,440 | $0 | $67,440 |
| 2022 | $1,719 | $45,820 | $0 | $45,820 |
| 2021 | $1,636 | $45,820 | $0 | $45,820 |
| 2020 | $1,717 | $45,820 | $0 | $45,820 |
| 2019 | $1,727 | $45,820 | $0 | $45,820 |
| 2018 | $1,665 | $45,820 | $0 | $45,820 |
| 2017 | $2,102 | $59,300 | $0 | $59,300 |
| 2016 | $2,061 | $59,300 | $0 | $59,300 |
| 2015 | $2,017 | $59,300 | $0 | $59,300 |
| 2014 | $2,018 | $59,300 | $0 | $59,300 |
Source: Public Records
Map
Nearby Homes
- 170 Trolley Crossing Ln Unit 170
- 55 Trolley Crossing Ln Unit 55
- 107 Cambridge Commons Unit 107
- 206 Cambridge Commons Unit 206
- 123 Burgundy Hill Ln
- 56 Burgundy Hill Ln Unit 56
- 11 Little River Ln
- 52 Rising Trail Dr
- 36 Rising Trail Dr Unit 36
- 162 Rising Trail Dr
- 6 Coles Rd
- 101 Morning Glory Dr
- 91C Country Squire Dr Unit 91C
- 15 G Country Squire Dr Unit 15G
- 37 Coles Rd
- 34 Apple Ln
- 30 Glenview Dr Unit 30
- 78 Rolling Green
- 15 Clubhouse Dr Unit 15
- 102 Greenview Terrace
- 108 Trolley Crossing Ln Unit 108
- 104 Trolley Crossing Ln
- 112 Trolley Crossing Ln
- 112 Trolley Crossing Ln Unit 112
- 100 Trolley Crossing Ln
- 106 Trolley Crossing Ln
- 102 Trolley Crossing Ln
- 102 Trolley Crossing Ln Unit 102
- 122 Trolley Crossing Ln
- 90 Trolley Crossing Ln
- 88 Trolley Crossing Ln
- 88 Trolley Crossing Ln Unit 88
- 86 Trolley Crossing Ln
- 86 Trolley Crossing Ln Unit 86
- 134 Trolley Crossing Ln
- 109 Trolley Crossing Ln
- 107 Trolley Crossing Ln
- 107 Trolley Crossing Ln Unit 107
- 105 Trolley Crossing Ln
- 105 Trolley Crossing Ln Unit 105