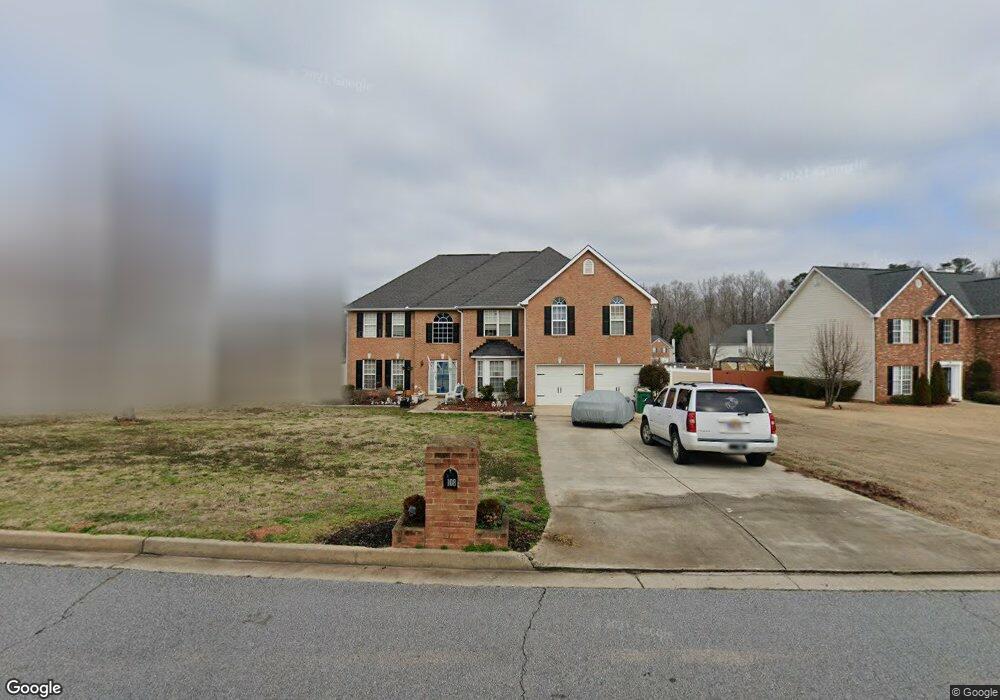
108 Tyler Ridge Unit 114 Jonesboro, GA 30238
Estimated Value: $367,000 - $410,000
5
Beds
3
Baths
3,612
Sq Ft
$107/Sq Ft
Est. Value
About This Home
This home is located at 108 Tyler Ridge Unit 114, Jonesboro, GA 30238 and is currently estimated at $387,996, approximately $107 per square foot. 108 Tyler Ridge Unit 114 is a home located in Clayton County with nearby schools including Brown Elementary School, Mundys Mill Middle School, and Mundy's Mill High School.
Ownership History
Date
Name
Owned For
Owner Type
Purchase Details
Closed on
Jul 18, 2022
Sold by
Opana Morris Kreszentia L
Bought by
Dunn Tamekia K
Current Estimated Value
Home Financials for this Owner
Home Financials are based on the most recent Mortgage that was taken out on this home.
Original Mortgage
$382,936
Outstanding Balance
$366,402
Interest Rate
5.78%
Mortgage Type
FHA
Estimated Equity
$21,594
Purchase Details
Closed on
Nov 15, 2016
Sold by
Williams Kenneth J
Bought by
Morris Kreszentia
Home Financials for this Owner
Home Financials are based on the most recent Mortgage that was taken out on this home.
Original Mortgage
$181,000
Interest Rate
3.52%
Mortgage Type
VA
Purchase Details
Closed on
Oct 31, 2000
Sold by
First Dimension Homes Inc
Bought by
Williams Kenneth J
Home Financials for this Owner
Home Financials are based on the most recent Mortgage that was taken out on this home.
Original Mortgage
$142,700
Interest Rate
7.82%
Mortgage Type
New Conventional
Create a Home Valuation Report for This Property
The Home Valuation Report is an in-depth analysis detailing your home's value as well as a comparison with similar homes in the area
Home Values in the Area
Average Home Value in this Area
Purchase History
| Date | Buyer | Sale Price | Title Company |
|---|---|---|---|
| Dunn Tamekia K | $390,000 | -- | |
| Morris Kreszentia | $181,000 | -- | |
| Williams Kenneth J | $178,400 | -- |
Source: Public Records
Mortgage History
| Date | Status | Borrower | Loan Amount |
|---|---|---|---|
| Open | Dunn Tamekia K | $382,936 | |
| Previous Owner | Morris Kreszentia | $181,000 | |
| Previous Owner | Williams Kenneth J | $142,700 |
Source: Public Records
Tax History Compared to Growth
Tax History
| Year | Tax Paid | Tax Assessment Tax Assessment Total Assessment is a certain percentage of the fair market value that is determined by local assessors to be the total taxable value of land and additions on the property. | Land | Improvement |
|---|---|---|---|---|
| 2024 | $5,348 | $136,120 | $9,600 | $126,520 |
| 2023 | $4,967 | $137,560 | $9,600 | $127,960 |
| 2022 | $4,361 | $110,160 | $9,600 | $100,560 |
| 2021 | $38 | $88,880 | $9,600 | $79,280 |
| 2020 | $38 | $84,276 | $9,600 | $74,676 |
| 2019 | $38 | $73,762 | $8,800 | $64,962 |
| 2018 | $38 | $73,288 | $8,800 | $64,488 |
| 2017 | $2,248 | $64,314 | $8,800 | $55,514 |
| 2016 | $2,181 | $62,656 | $8,800 | $53,856 |
| 2015 | $2,436 | $0 | $0 | $0 |
| 2014 | $2,244 | $65,436 | $8,800 | $56,636 |
Source: Public Records
Map
Nearby Homes
- 157 Tyler Ridge Unit II
- 9725 Tyler Terrace Unit 1
- 0 Highway 54 Unit 10613856
- 9579 Fayetteville Rd
- 9579 Highway 54 W
- 9941 Musket Ridge Cir
- 230 Blue Heron Dr
- 9550 Canvasback Ct
- 226 Woodwind Way
- 9542 Canvasback Ct
- 9716 Holly Hill Way
- 9541 Canvasback Ct
- 90 Inverness Trace
- 304 Deerfield Dr
- 49 Diana Ct
- 247 Water Oak Ln
- 9430 Sleepy Hollow Ln
- 170 Inverness Trace
- 281 Willow Springs Dr
- 288 Country Club Dr
- 108 Tyler Ridge
- 96 Tyler Ridge
- 116 Tyler Ridge Unit C113
- 116 Tyler Ridge Unit 2
- 88 Tyler Ridge Unit 2
- 0 Tyler Ridge Unit 8653346
- 0 Tyler Ridge Unit 8599959
- 0 Tyler Ridge Unit 3161201
- 0 Tyler Ridge Unit 3086469
- 0 Tyler Ridge Unit 3142884
- 0 Tyler Ridge Unit 3188703
- 0 Tyler Ridge Unit 3215118
- 0 Tyler Ridge Unit 3284719
- 0 Tyler Ridge Unit 7437511
- 0 Tyler Ridge
- 130 Tyler Ridge
- 9518 Tyler Terrace Unit 2
- 9510 Tyler Terrace Unit 2
- 115 Tyler Ridge
- 9526 Tyler Terrace Unit II