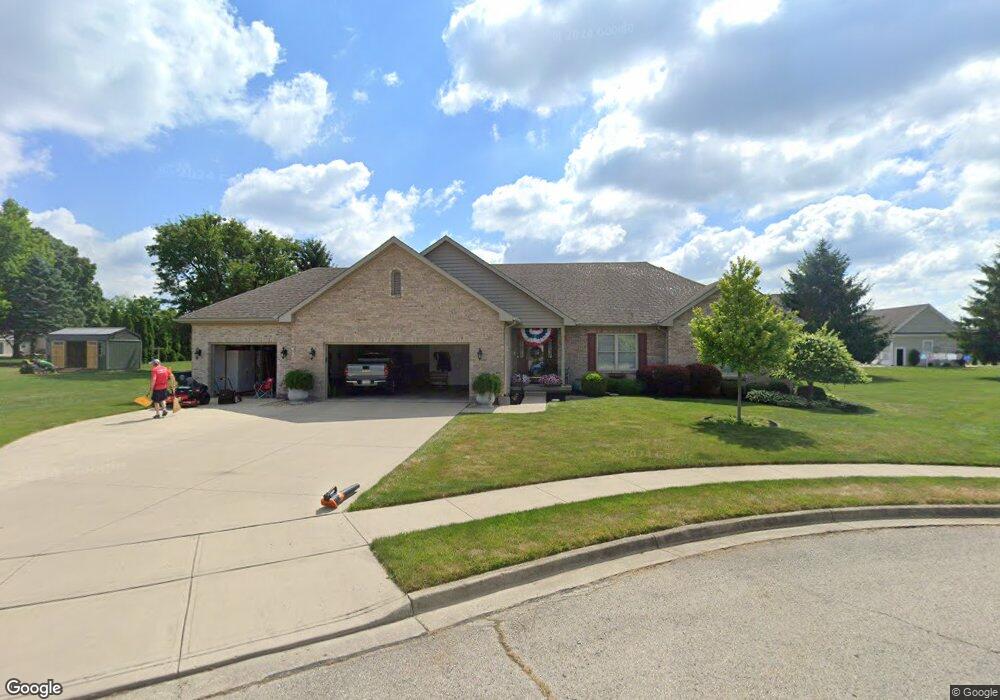
108 Vine St Covington, OH 45318
Estimated Value: $334,077 - $370,000
3
Beds
2
Baths
2,213
Sq Ft
$160/Sq Ft
Est. Value
About This Home
This home is located at 108 Vine St, Covington, OH 45318 and is currently estimated at $354,769, approximately $160 per square foot. 108 Vine St is a home located in Miami County with nearby schools including Covington Elementary/Junior High School, Covington Junior High School, and Covington High School.
Ownership History
Date
Name
Owned For
Owner Type
Purchase Details
Closed on
Mar 3, 2008
Sold by
Stickley Suzanne D
Bought by
Longendelpher Jerry G and Longendelpher Vicki L
Current Estimated Value
Home Financials for this Owner
Home Financials are based on the most recent Mortgage that was taken out on this home.
Original Mortgage
$145,050
Outstanding Balance
$87,903
Interest Rate
5.75%
Mortgage Type
New Conventional
Estimated Equity
$266,866
Purchase Details
Closed on
Oct 25, 1999
Sold by
New Tech Plastics Inc
Bought by
Stickley James A and Stickley Suzanne D
Purchase Details
Closed on
Jan 1, 1990
Bought by
New Tech Plastics Inc
Create a Home Valuation Report for This Property
The Home Valuation Report is an in-depth analysis detailing your home's value as well as a comparison with similar homes in the area
Home Values in the Area
Average Home Value in this Area
Purchase History
| Date | Buyer | Sale Price | Title Company |
|---|---|---|---|
| Longendelpher Jerry G | $193,400 | -- | |
| Stickley James A | $32,000 | -- | |
| New Tech Plastics Inc | -- | -- |
Source: Public Records
Mortgage History
| Date | Status | Borrower | Loan Amount |
|---|---|---|---|
| Open | Stickley James A | $145,050 |
Source: Public Records
Tax History
| Year | Tax Paid | Tax Assessment Tax Assessment Total Assessment is a certain percentage of the fair market value that is determined by local assessors to be the total taxable value of land and additions on the property. | Land | Improvement |
|---|---|---|---|---|
| 2025 | $4,484 | $137,380 | $14,700 | $122,680 |
| 2024 | $4,484 | $83,860 | $14,700 | $69,160 |
| 2023 | $3,141 | $83,860 | $14,700 | $69,160 |
| 2022 | $3,133 | $83,860 | $14,700 | $69,160 |
| 2021 | $3,382 | $83,860 | $14,700 | $69,160 |
| 2020 | $3,390 | $83,860 | $14,700 | $69,160 |
| 2019 | $3,405 | $83,860 | $14,700 | $69,160 |
| 2018 | $3,185 | $78,260 | $15,890 | $62,370 |
| 2017 | $3,241 | $78,260 | $15,890 | $62,370 |
| 2016 | $3,199 | $78,260 | $15,890 | $62,370 |
| 2015 | $2,838 | $72,450 | $14,700 | $57,750 |
| 2014 | $2,838 | $72,450 | $14,700 | $57,750 |
| 2013 | $2,732 | $72,450 | $14,700 | $57,750 |
Source: Public Records
Map
Nearby Homes
Your Personal Tour Guide
Ask me questions while you tour the home.