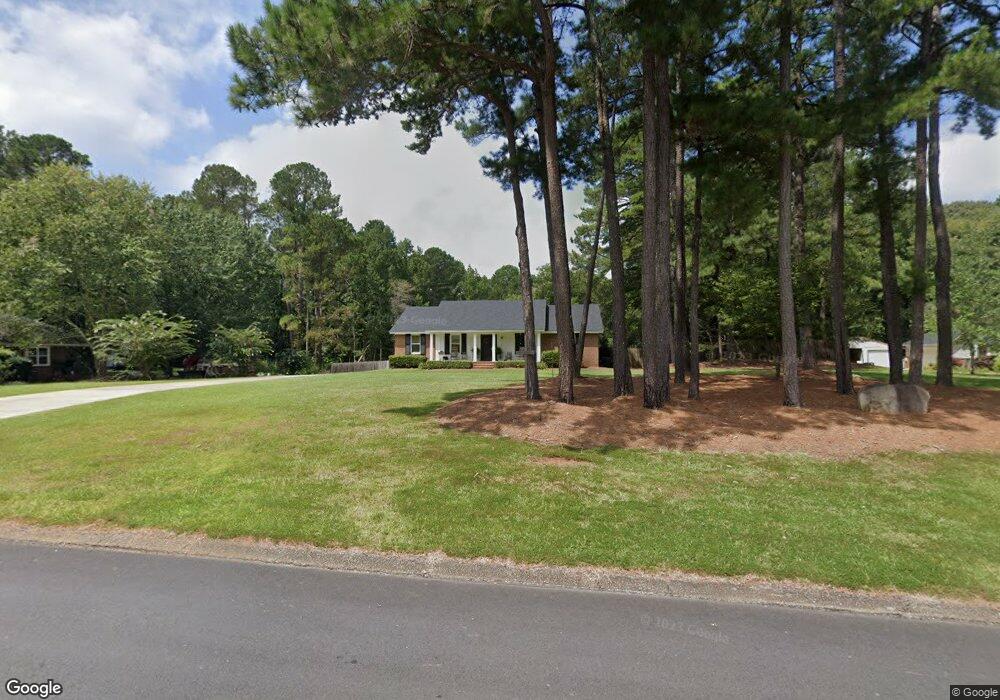
108 Wood Creek Ln Appling, GA 30802
Estimated Value: $299,000 - $405,000
3
Beds
2
Baths
1,591
Sq Ft
$213/Sq Ft
Est. Value
About This Home
This home is located at 108 Wood Creek Ln, Appling, GA 30802 and is currently estimated at $339,383, approximately $213 per square foot. 108 Wood Creek Ln is a home located in Columbia County with nearby schools including North Columbia Elementary School, Harlem Middle School, and Harlem High School.
Ownership History
Date
Name
Owned For
Owner Type
Purchase Details
Closed on
Jul 21, 2014
Sold by
Hair Jon
Bought by
Evans Trent L
Current Estimated Value
Home Financials for this Owner
Home Financials are based on the most recent Mortgage that was taken out on this home.
Original Mortgage
$133,000
Outstanding Balance
$101,609
Interest Rate
4.24%
Mortgage Type
New Conventional
Estimated Equity
$237,774
Purchase Details
Closed on
Feb 28, 2006
Sold by
Ling James W
Bought by
Hair Jon
Home Financials for this Owner
Home Financials are based on the most recent Mortgage that was taken out on this home.
Original Mortgage
$117,300
Interest Rate
6.19%
Mortgage Type
New Conventional
Purchase Details
Closed on
Feb 4, 2004
Sold by
Pro Investment Inc
Bought by
Ling James W
Home Financials for this Owner
Home Financials are based on the most recent Mortgage that was taken out on this home.
Original Mortgage
$92,800
Interest Rate
3.62%
Mortgage Type
Purchase Money Mortgage
Create a Home Valuation Report for This Property
The Home Valuation Report is an in-depth analysis detailing your home's value as well as a comparison with similar homes in the area
Home Values in the Area
Average Home Value in this Area
Purchase History
| Date | Buyer | Sale Price | Title Company |
|---|---|---|---|
| Evans Trent L | $140,000 | -- | |
| Evans Trent L | $140,000 | -- | |
| Hair Jon | $138,000 | -- | |
| Ling James W | $116,000 | -- | |
| Pro Investment Inc | -- | -- |
Source: Public Records
Mortgage History
| Date | Status | Borrower | Loan Amount |
|---|---|---|---|
| Open | Evans Trent L | $133,000 | |
| Closed | Evans Trent L | $133,000 | |
| Previous Owner | Hair Jon | $117,300 | |
| Previous Owner | Pro Investment Inc | $92,800 | |
| Closed | Pro Investment Inc | $17,300 |
Source: Public Records
Tax History Compared to Growth
Tax History
| Year | Tax Paid | Tax Assessment Tax Assessment Total Assessment is a certain percentage of the fair market value that is determined by local assessors to be the total taxable value of land and additions on the property. | Land | Improvement |
|---|---|---|---|---|
| 2025 | $2,654 | $110,785 | $18,747 | $92,038 |
| 2024 | $3,072 | $122,577 | $19,147 | $103,430 |
| 2023 | $3,072 | $106,754 | $19,047 | $87,707 |
| 2022 | $2,243 | $86,004 | $16,947 | $69,057 |
| 2021 | $2,212 | $81,155 | $16,947 | $64,208 |
| 2020 | $1,950 | $70,071 | $15,447 | $54,624 |
| 2019 | $1,927 | $69,210 | $15,047 | $54,163 |
| 2018 | $1,927 | $68,987 | $15,047 | $53,940 |
| 2017 | $1,773 | $63,215 | $15,247 | $47,968 |
| 2016 | $1,620 | $59,897 | $13,908 | $45,989 |
| 2015 | $1,517 | $55,960 | $12,208 | $43,752 |
| 2014 | $1,562 | $56,952 | $10,608 | $46,344 |
Source: Public Records
Map
Nearby Homes
- 307 Alabaster Ct
- 1171 Meandering Trail
- 1229 Yost Dr
- 7115 Exley Ln
- 4052 Highfield Dr
- 3256 Ray Owens Rd
- 2526 Scotts Ferry Rd
- 1123 Meandering Trail
- 1153 Meandering Trail
- 1147 Meandering Trail
- 1129 Meandering Trail
- 6662 Shucraft Rd
- 2829 Sellars Rd
- 2839 Sellars Rd
- 2362 Pine Ridge Dr
- 215 Dublin Loop
- 219 Dublin Loop
- 211 Dublin Loop
- 243 Ronda Ct
- 2414 Bundoran Dr
- 106 Wood Creek Ln
- 110 Wood Creek Ln
- 105 Wood Creek Ln
- 104 Wood Creek Ln
- 107 Wood Creek Ln
- 103 Wood Creek Ln
- 112 Wood Creek Ln
- 102 Wood Creek Ln
- 101 Wood Creek Ln
- 6261 Columbia Rd
- 114 Wood Creek Ln
- 119 Crystal Creek Ln
- 113 Crystal Creek Ln
- 115 Crystal Creek Ln
- 115 Wood Creek Ct
- 109 Crystal Creek Ln
- 117 Crystal Creek Ln
- 103 Crystal Creek Ln
- 111 Wood Creek Ct
- 6235 Columbia Rd