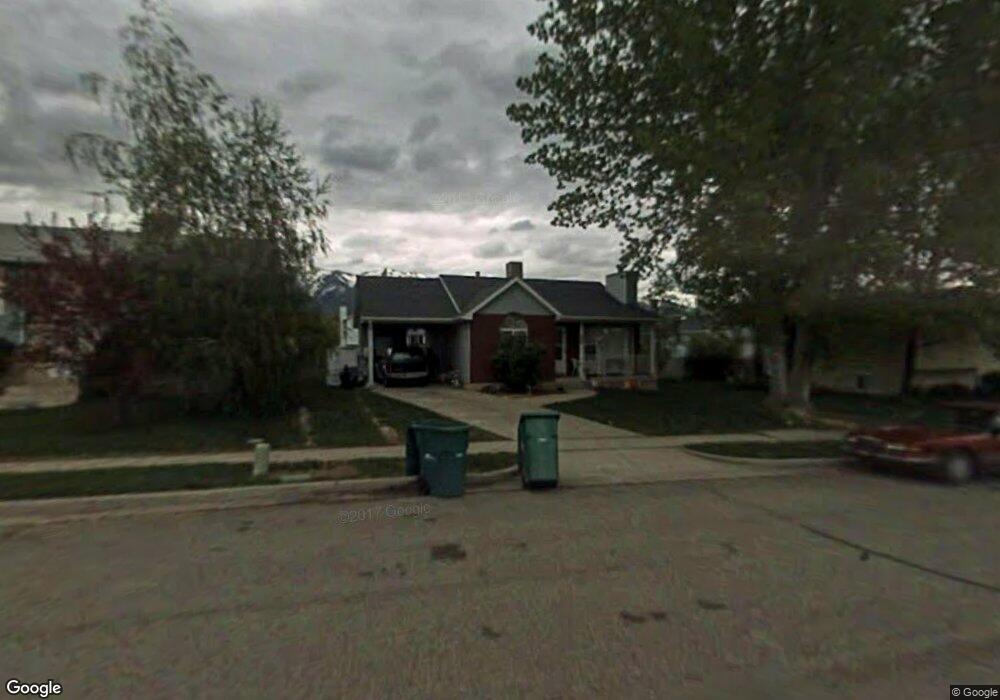
1080 N 200 W Layton, UT 84041
Estimated Value: $342,000 - $426,000
2
Beds
2
Baths
846
Sq Ft
$455/Sq Ft
Est. Value
About This Home
This home is located at 1080 N 200 W, Layton, UT 84041 and is currently estimated at $384,763, approximately $454 per square foot. 1080 N 200 W is a home located in Davis County with nearby schools including Crestview Elementary School, Central Davis Junior High School, and Northridge High School.
Ownership History
Date
Name
Owned For
Owner Type
Purchase Details
Closed on
Aug 15, 2005
Sold by
Stevenson Eric C and Stevenson Jane M
Bought by
Stevenson Management Llc
Current Estimated Value
Purchase Details
Closed on
May 10, 2000
Sold by
Stevenson Eric C
Bought by
Stevenson Eric C and Stevenson Jane M
Purchase Details
Closed on
Mar 23, 1998
Sold by
Stevenson Kaylene C
Bought by
Stevenson Eric C
Create a Home Valuation Report for This Property
The Home Valuation Report is an in-depth analysis detailing your home's value as well as a comparison with similar homes in the area
Home Values in the Area
Average Home Value in this Area
Purchase History
| Date | Buyer | Sale Price | Title Company |
|---|---|---|---|
| Stevenson Management Llc | -- | Mountain View Title & Escrow | |
| Stevenson Eric C | -- | Bonneville Title Company Inc | |
| Stevenson Eric C | -- | Bonneville Title Company Inc |
Source: Public Records
Tax History Compared to Growth
Tax History
| Year | Tax Paid | Tax Assessment Tax Assessment Total Assessment is a certain percentage of the fair market value that is determined by local assessors to be the total taxable value of land and additions on the property. | Land | Improvement |
|---|---|---|---|---|
| 2025 | $1,829 | $191,950 | $89,910 | $102,040 |
| 2024 | $1,737 | $183,699 | $105,447 | $78,252 |
| 2023 | $1,760 | $180,400 | $72,540 | $107,859 |
| 2022 | $1,782 | $328,000 | $123,208 | $204,792 |
| 2021 | $1,643 | $248,000 | $90,054 | $157,946 |
| 2020 | $1,492 | $216,000 | $77,849 | $138,151 |
| 2019 | $1,481 | $210,000 | $75,880 | $134,120 |
| 2018 | $1,320 | $188,000 | $75,880 | $112,120 |
| 2016 | $1,209 | $88,770 | $22,884 | $65,886 |
| 2015 | $1,135 | $79,145 | $22,884 | $56,261 |
| 2014 | $1,028 | $73,274 | $22,884 | $50,390 |
| 2013 | -- | $78,523 | $20,620 | $57,903 |
Source: Public Records
Map
Nearby Homes