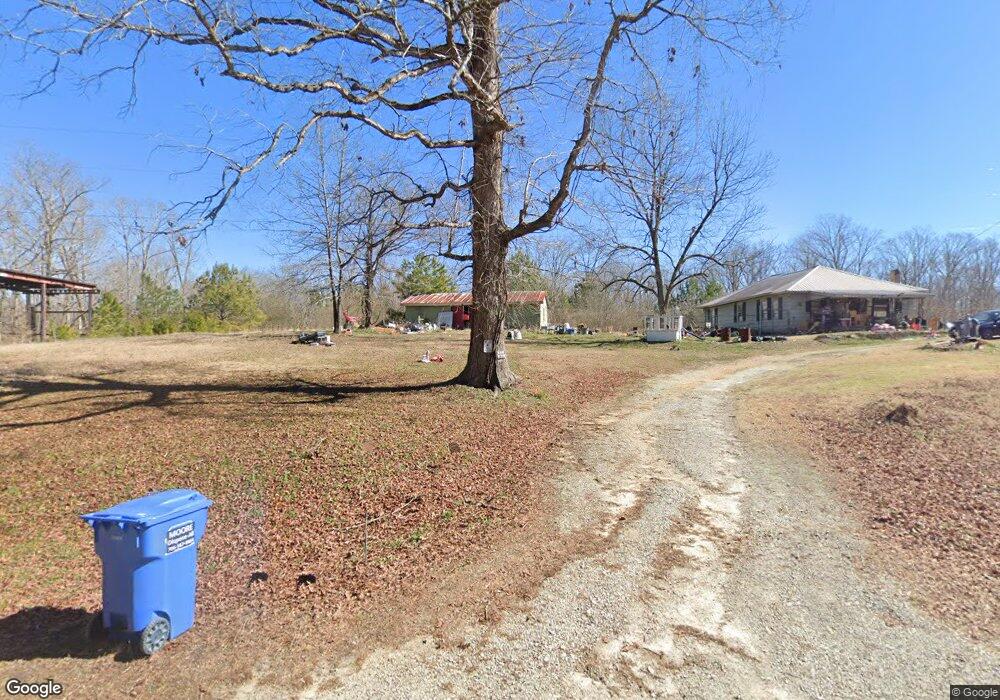
1080 Stinchcomb Rd Elberton, GA 30635
Estimated Value: $63,000 - $202,000
Studio
1
Bath
1,200
Sq Ft
$102/Sq Ft
Est. Value
About This Home
This home is located at 1080 Stinchcomb Rd, Elberton, GA 30635 and is currently estimated at $122,061, approximately $101 per square foot. 1080 Stinchcomb Rd is a home located in Elbert County with nearby schools including Elbert County Elementary School, Elbert County Primary School, and Elbert County Middle School.
Ownership History
Date
Name
Owned For
Owner Type
Purchase Details
Closed on
Oct 17, 2014
Sold by
Bond Donna Rose Davis
Bought by
Degrave Chana L
Current Estimated Value
Purchase Details
Closed on
Nov 19, 2004
Sold by
Davis Norma Lee Duffel
Bought by
Bond Donna Rose Davis
Purchase Details
Closed on
Jul 1, 1991
Sold by
Davis Mrs Norma Lee Duffell and Davis
Bought by
Davis Mrs Norma Lee Duffell and Davis Micha
Purchase Details
Closed on
Apr 17, 1965
Sold by
Harris William O
Bought by
Davis Lee Clark
Purchase Details
Closed on
Jul 17, 1964
Sold by
Almond Milton S
Bought by
Davis Lee C
Purchase Details
Closed on
Apr 13, 1963
Sold by
Almond M Steve
Bought by
Almond Milton S
Purchase Details
Closed on
Dec 4, 1961
Sold by
Drennan Henry Grady and Drennan
Bought by
Almond Milton S and Almond Steve M
Purchase Details
Closed on
Jul 18, 1951
Sold by
Harris W O
Bought by
Drennan Mrs Henry K
Create a Home Valuation Report for This Property
The Home Valuation Report is an in-depth analysis detailing your home's value as well as a comparison with similar homes in the area
Home Values in the Area
Average Home Value in this Area
Purchase History
| Date | Buyer | Sale Price | Title Company |
|---|---|---|---|
| Degrave Chana L | -- | -- | |
| Bond Donna Rose Davis | -- | -- | |
| Davis Mrs Norma Lee Duffell | -- | -- | |
| Davis Lee Clark | -- | -- | |
| Davis Lee C | -- | -- | |
| Almond Milton S | -- | -- | |
| Almond Milton S | -- | -- | |
| Drennan Mrs Henry K | -- | -- |
Source: Public Records
Tax History
| Year | Tax Paid | Tax Assessment Tax Assessment Total Assessment is a certain percentage of the fair market value that is determined by local assessors to be the total taxable value of land and additions on the property. | Land | Improvement |
|---|---|---|---|---|
| 2025 | $737 | $31,467 | $10,552 | $20,915 |
| 2024 | $684 | $28,541 | $9,175 | $19,366 |
| 2023 | $684 | $28,541 | $9,175 | $19,366 |
| 2022 | $548 | $22,847 | $5,462 | $17,385 |
| 2021 | $549 | $22,847 | $5,462 | $17,385 |
| 2020 | $484 | $17,791 | $4,369 | $13,422 |
| 2019 | $502 | $17,791 | $4,369 | $13,422 |
| 2018 | $499 | $17,791 | $4,369 | $13,422 |
| 2017 | $519 | $16,518 | $4,369 | $12,149 |
| 2016 | $485 | $16,518 | $4,369 | $12,149 |
| 2015 | -- | $16,518 | $4,369 | $12,149 |
| 2014 | -- | $17,957 | $4,369 | $13,588 |
| 2013 | -- | $17,957 | $4,369 | $13,588 |
Source: Public Records
Map
Nearby Homes
- 2405 Athens Hwy
- 1163 Nickville Rd
- 0 Stinchcomb Rd Unit 10669701
- 737 Broad River Rd
- 1752 Athens Hwy
- 217 Broad River Rd
- 295 Berkeley Rd
- 1651 Athens Hwy
- 376 Paoli Rd
- 00 River Rd
- 275 Emma Cooper Rd
- 0 River Rd Unit 10639917
- 6367 Highway 72 E
- 0 Crystal Dr Unit 10400125
- 1702 Jones Ferry Rd
- 2607 Hughes Rd
- 00 Athens Hwy
- 2224 Osley Mill Rd
- 1936 Tanglewood Dr
- 0 Sand Hill Rd Unit 10733736
- 1082 Stinchcomb Rd
- 2690 Reagin Dr
- 1130 Stinchcomb Rd
- 1019 Stinchcomb Rd
- 2348 Athens Hwy
- 1105 Stinchcomb Rd
- 1139 Stinchcomb Rd
- 00 Stinchcomb Rd
- 2453 Athens Hwy
- 4 Vista Dr
- 1167 Stinchcomb Rd
- 2403 Athens Hwy
- 2240 Vista Dr
- 2236 Edna Rd
- 2235 Edna Rd
- 2238 Vista Dr
- 2234 Edna Rd
- 1068 Sam Paul Rd
- 1212 Stinchcomb Rd
- 2208 Edna Rd
Your Personal Tour Guide
Ask me questions while you tour the home.