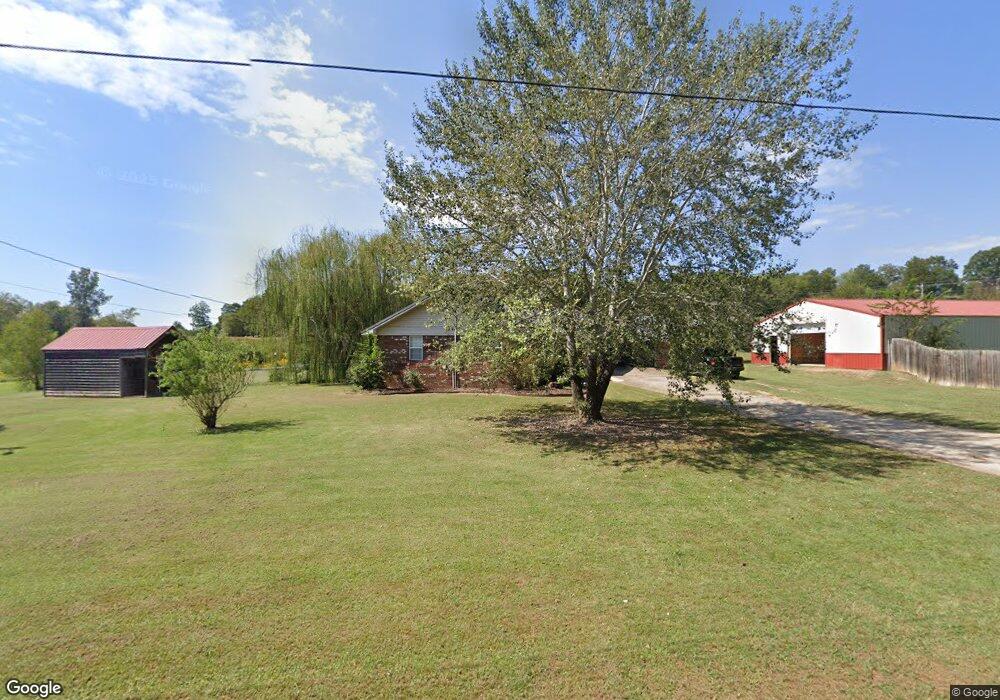
108038 S 4729 Rd Muldrow, OK 74948
Estimated Value: $182,947 - $247,000
3
Beds
2
Baths
1,544
Sq Ft
$139/Sq Ft
Est. Value
About This Home
This home is located at 108038 S 4729 Rd, Muldrow, OK 74948 and is currently estimated at $214,987, approximately $139 per square foot. 108038 S 4729 Rd is a home located in Sequoyah County with nearby schools including Muldrow Elementary School, Muldrow Middle School, and Muldrow High School.
Ownership History
Date
Name
Owned For
Owner Type
Purchase Details
Closed on
Aug 30, 2022
Sold by
Flanagan Ronal and Flanagan Lori
Bought by
Flanagan Ronal and Flanagan Lori
Current Estimated Value
Purchase Details
Closed on
Mar 31, 2008
Sold by
Cox Dina Lurae and Cox Tony
Bought by
Edwards Archie and Edwards Donna
Home Financials for this Owner
Home Financials are based on the most recent Mortgage that was taken out on this home.
Original Mortgage
$87,653
Interest Rate
6.11%
Mortgage Type
Future Advance Clause Open End Mortgage
Purchase Details
Closed on
Mar 14, 2008
Sold by
Edwards Archie C and Edwards Donna L
Bought by
Flanagan Ronal
Home Financials for this Owner
Home Financials are based on the most recent Mortgage that was taken out on this home.
Original Mortgage
$87,653
Interest Rate
6.11%
Mortgage Type
Future Advance Clause Open End Mortgage
Create a Home Valuation Report for This Property
The Home Valuation Report is an in-depth analysis detailing your home's value as well as a comparison with similar homes in the area
Home Values in the Area
Average Home Value in this Area
Purchase History
| Date | Buyer | Sale Price | Title Company |
|---|---|---|---|
| Flanagan Ronal | -- | -- | |
| Flanagan Ronal | -- | None Listed On Document | |
| Edwards Archie | $120,000 | None Available | |
| Flanagan Ronal | $102,000 | None Available |
Source: Public Records
Mortgage History
| Date | Status | Borrower | Loan Amount |
|---|---|---|---|
| Previous Owner | Edwards Archie | $87,653 | |
| Previous Owner | Flanagan Ronal | $81,600 |
Source: Public Records
Tax History Compared to Growth
Tax History
| Year | Tax Paid | Tax Assessment Tax Assessment Total Assessment is a certain percentage of the fair market value that is determined by local assessors to be the total taxable value of land and additions on the property. | Land | Improvement |
|---|---|---|---|---|
| 2024 | $830 | $11,130 | $1,196 | $9,934 |
| 2023 | $791 | $10,601 | $1,196 | $9,405 |
| 2022 | $765 | $10,769 | $1,299 | $9,470 |
| 2021 | $768 | $10,809 | $1,299 | $9,510 |
| 2020 | $757 | $10,659 | $1,298 | $9,361 |
| 2019 | $778 | $10,951 | $1,298 | $9,653 |
| 2018 | $790 | $11,116 | $1,298 | $9,818 |
| 2017 | $811 | $11,418 | $1,298 | $10,120 |
| 2016 | $822 | $11,567 | $1,298 | $10,269 |
| 2015 | $834 | $11,743 | $1,298 | $10,445 |
| 2014 | $872 | $12,265 | $1,298 | $10,967 |
Source: Public Records
Map
Nearby Homes
- 107774 S 4720
- 108412 S 4720 Rd
- 475745 E 1083 Rd
- 109651 S 4720 Rd
- 471703 E 1083 Rd
- 471804 E 1070 Rd
- TBD S 4727 Rd
- Tbd Water Tower Rd
- 203 Pendergrass St
- 106214 S 4720 Rd
- TBD S 4720 Rd
- 103 NE 1st St
- 1 Oklahoma 64b
- 106078 S 4715 Rd
- 109365 S 4749 Rd
- 105629 S 4730 Rd
- 304 Oakdale Rd
- 101 NE 2nd St
- 103756 Oklahoma 64b
- TBD Hugo St
- 108062 State Highway 64b
- 108062 State Highway 64b
- 472808 E 1080 Rd
- 108015 S 4729 Rd
- 472794 E 1080 Rd
- 108125 S 4729 Rd
- 472830 E 1080 Rd
- 472650 E 1080 Rd
- 472650 E 1080 Rd
- 472745 E 1080 Rd
- 472743 E 1080 Rd
- 472783 E 1080 Rd
- 108126 S 4729 Rd
- 473078 E 1080 Rd
- 108158 S 4729 Rd
- 473575 E 1080 Rd
- 472572 E 1080 Rd
- 108235 State Highway 64b
- 108235 Oklahoma 64b
- 473135 E 1080 Rd