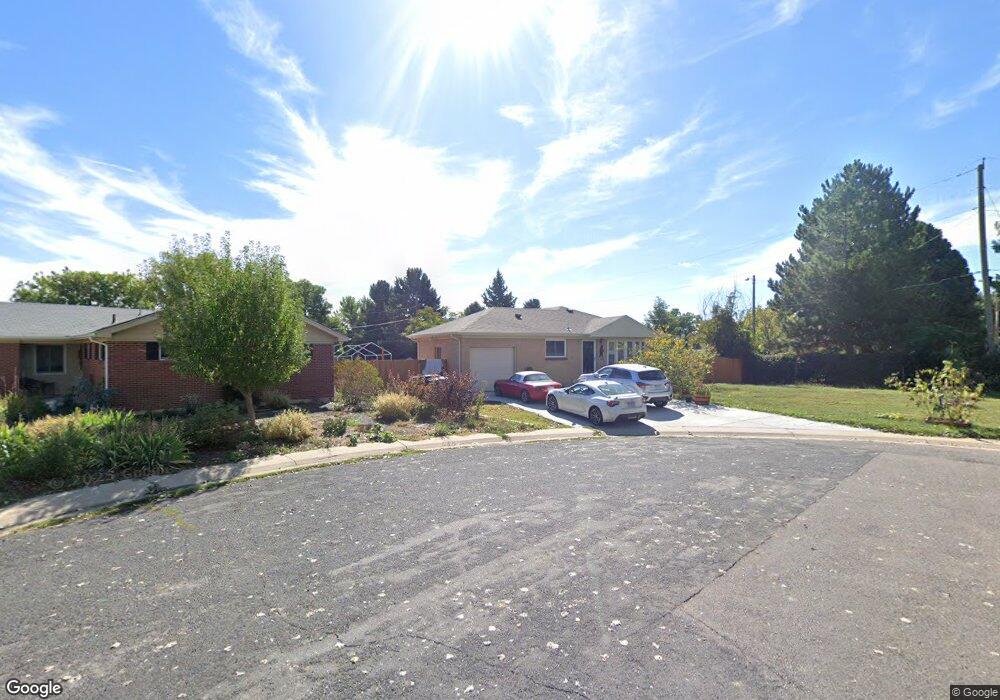
10804 Clarkson St Northglenn, CO 80233
Estimated Value: $442,000 - $494,000
4
Beds
2
Baths
2,008
Sq Ft
$232/Sq Ft
Est. Value
About This Home
This home is located at 10804 Clarkson St, Northglenn, CO 80233 and is currently estimated at $465,932, approximately $232 per square foot. 10804 Clarkson St is a home located in Adams County with nearby schools including Woodglen Elementary School, Leroy Drive Elementary School, and Northglenn Middle School.
Ownership History
Date
Name
Owned For
Owner Type
Purchase Details
Closed on
Dec 19, 2019
Sold by
The Buy Out5 Company
Bought by
Kozma Joseph Lewis and Kozma Rhonda Sue
Current Estimated Value
Home Financials for this Owner
Home Financials are based on the most recent Mortgage that was taken out on this home.
Original Mortgage
$332,500
Outstanding Balance
$293,147
Interest Rate
3.6%
Mortgage Type
VA
Estimated Equity
$172,785
Purchase Details
Closed on
Sep 6, 2019
Sold by
Nelson Karen R
Bought by
The Buy Out Company
Purchase Details
Closed on
Nov 18, 2003
Sold by
Nelson Carl F
Bought by
Nelson Carl F and Nelson Karen R
Home Financials for this Owner
Home Financials are based on the most recent Mortgage that was taken out on this home.
Original Mortgage
$100,000
Interest Rate
6.06%
Mortgage Type
Unknown
Purchase Details
Closed on
May 30, 1995
Sold by
Robinson A Dale
Bought by
Robinson A Dale and Robinson Lavette K
Purchase Details
Closed on
Jul 30, 1991
Create a Home Valuation Report for This Property
The Home Valuation Report is an in-depth analysis detailing your home's value as well as a comparison with similar homes in the area
Home Values in the Area
Average Home Value in this Area
Purchase History
| Date | Buyer | Sale Price | Title Company |
|---|---|---|---|
| Kozma Joseph Lewis | $332,500 | Heritage Title Company | |
| The Buy Out Company | $263,000 | Heritage Title Company | |
| Nelson Carl F | -- | Commerce Title | |
| Robinson A Dale | -- | -- | |
| -- | $58,500 | -- |
Source: Public Records
Mortgage History
| Date | Status | Borrower | Loan Amount |
|---|---|---|---|
| Open | Kozma Joseph Lewis | $332,500 | |
| Previous Owner | Nelson Carl F | $100,000 |
Source: Public Records
Tax History Compared to Growth
Tax History
| Year | Tax Paid | Tax Assessment Tax Assessment Total Assessment is a certain percentage of the fair market value that is determined by local assessors to be the total taxable value of land and additions on the property. | Land | Improvement |
|---|---|---|---|---|
| 2024 | $3,562 | $29,000 | $5,750 | $23,250 |
| 2023 | $3,529 | $33,550 | $5,610 | $27,940 |
| 2022 | $3,150 | $24,940 | $5,770 | $19,170 |
| 2021 | $3,250 | $24,940 | $5,770 | $19,170 |
| 2020 | $2,997 | $23,460 | $5,930 | $17,530 |
| 2019 | $2,999 | $23,460 | $5,930 | $17,530 |
| 2018 | $2,294 | $17,490 | $5,400 | $12,090 |
| 2017 | $2,111 | $17,490 | $5,400 | $12,090 |
| 2016 | $1,695 | $13,710 | $3,020 | $10,690 |
| 2015 | $1,692 | $13,710 | $3,020 | $10,690 |
| 2014 | -- | $11,970 | $2,390 | $9,580 |
Source: Public Records
Map
Nearby Homes
- 925 E 108th Ave
- 10752 Blue Jay Ln
- 10966 Alvin Dr
- 11068 Ogden St
- 10674 Downing St
- 1102 Leroy Dr
- 189 E 107th Place
- 500 E 111th Place
- 1324 Lucille Ct
- 105 Pike St
- 380 E 111th Place
- 10761 Rosalie Dr
- 10440 Pennsylvania St
- 10452 Washington Way
- 10453 Washington Way
- 10475 Grant Dr
- 1462 E 110th Place
- 10951 Acoma St
- 10472 Lincoln Ct
- 10429 Lafayette St
- 10814 Clarkson St
- 10803 Larson Dr
- 10813 Larson Dr
- 10805 Clarkson St
- 10834 Clarkson St
- 10815 Clarkson St
- 10825 Clarkson St
- 10823 Larson Dr
- 10844 Clarkson St
- 10835 Clarkson St
- 905 E 108th Ave
- 10833 Larson Dr
- 10820 Mildred Dr
- 10854 Clarkson St
- 10845 Clarkson St
- 904 E 108th Ave
- 10821 Mildred Dr
- 10830 Mildred Dr
- 10843 Larson Dr
- 10855 Clarkson St