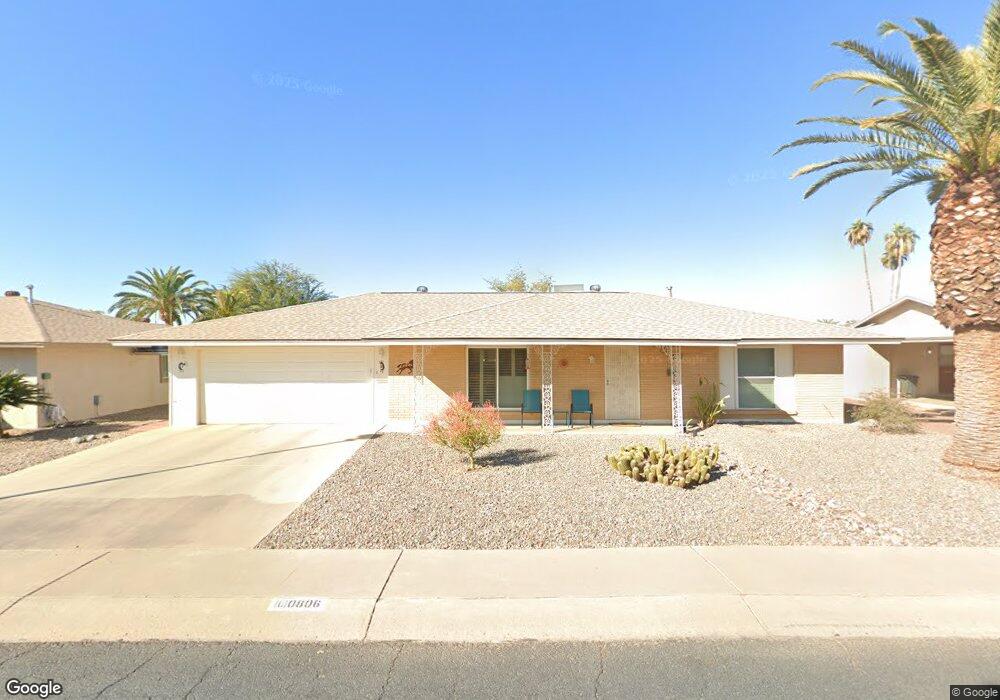
10806 W Tropicana Cir Sun City, AZ 85351
Estimated Value: $242,863 - $306,000
--
Bed
2
Baths
1,299
Sq Ft
$217/Sq Ft
Est. Value
About This Home
This home is located at 10806 W Tropicana Cir, Sun City, AZ 85351 and is currently estimated at $282,466, approximately $217 per square foot. 10806 W Tropicana Cir is a home located in Maricopa County with nearby schools including Desert Mirage Elementary School and Sonoran Science Academy-Peoria.
Ownership History
Date
Name
Owned For
Owner Type
Purchase Details
Closed on
Sep 5, 2018
Sold by
Henriksen Neil and Henriksen Christine
Bought by
Henriksen Neil A and The Neil A Henriksen And Chris
Current Estimated Value
Purchase Details
Closed on
Apr 18, 2016
Sold by
Tarbox Harold Wayne and Tarbox Emelda
Bought by
Henriksen Neil and Henriksen Christine
Home Financials for this Owner
Home Financials are based on the most recent Mortgage that was taken out on this home.
Original Mortgage
$103,200
Outstanding Balance
$81,878
Interest Rate
3.64%
Mortgage Type
New Conventional
Estimated Equity
$200,588
Purchase Details
Closed on
Aug 8, 2008
Sold by
Tarbox Emma M
Bought by
Tarbox Harold Wayne and Tarbox Emelda
Home Financials for this Owner
Home Financials are based on the most recent Mortgage that was taken out on this home.
Original Mortgage
$70,000
Interest Rate
6.32%
Mortgage Type
New Conventional
Create a Home Valuation Report for This Property
The Home Valuation Report is an in-depth analysis detailing your home's value as well as a comparison with similar homes in the area
Home Values in the Area
Average Home Value in this Area
Purchase History
| Date | Buyer | Sale Price | Title Company |
|---|---|---|---|
| Henriksen Neil A | -- | None Available | |
| Henriksen Neil | $129,000 | Great American Title Agency | |
| Tarbox Harold Wayne | $90,000 | Capital Title Agency Inc |
Source: Public Records
Mortgage History
| Date | Status | Borrower | Loan Amount |
|---|---|---|---|
| Open | Henriksen Neil | $103,200 | |
| Previous Owner | Tarbox Harold Wayne | $70,000 |
Source: Public Records
Tax History Compared to Growth
Tax History
| Year | Tax Paid | Tax Assessment Tax Assessment Total Assessment is a certain percentage of the fair market value that is determined by local assessors to be the total taxable value of land and additions on the property. | Land | Improvement |
|---|---|---|---|---|
| 2025 | $1,018 | $11,647 | -- | -- |
| 2024 | $933 | $11,093 | -- | -- |
| 2023 | $933 | $20,870 | $4,170 | $16,700 |
| 2022 | $882 | $16,310 | $3,260 | $13,050 |
| 2021 | $901 | $15,180 | $3,030 | $12,150 |
| 2020 | $879 | $13,300 | $2,660 | $10,640 |
| 2019 | $864 | $12,360 | $2,470 | $9,890 |
| 2018 | $841 | $11,200 | $2,240 | $8,960 |
| 2017 | $809 | $9,950 | $1,990 | $7,960 |
| 2016 | $461 | $9,320 | $1,860 | $7,460 |
| 2015 | $729 | $8,360 | $1,670 | $6,690 |
Source: Public Records
Map
Nearby Homes
- 10760 W Saratoga Cir
- 10734 W El Capitan Cir
- 10820 W Sarabande Cir
- 10739 W Saratoga Cir
- 11113 W Tiffany Ct
- 10722 W El Capitan Cir
- 10733 W Saratoga Cir
- 10837 W Tropicana Cir
- 10907 W Saratoga Cir
- 10731 W Tropicana Cir
- 10710 W El Capitan Cir
- 10720 W Saratoga Cir
- 11037 W Meade Dr
- 11181 W Cameo Dr
- 10701 W El Capitan Cir
- 10722 W Tropicana Cir
- 11114 W Peace Ct
- 10921 W El Capitan Cir Unit 11
- 14249 N Sarabande Way
- 10927 W White Mountain Rd
- 10804 W Tropicana Cir
- 10808 W Tropicana Cir
- 10807 W Sarabande Cir Unit 11
- 10809 W Sarabande Cir
- 10805 W Sarabande Cir
- 10810 W Tropicana Cir
- 10802 W Tropicana Cir
- 10807 W Tropicana Cir
- 10805 W Tropicana Cir
- 10811 W Sarabande Cir
- 10809 W Tropicana Cir
- 10801 W Sarabande Cir Unit 11
- 10801 W Tropicana Cir
- 10812 W Tropicana Cir
- 10813 W Sarabande Cir
- 10811 W Tropicana Cir
- 10808 W Sarabande Cir Unit 11A
- 10806 W Saratoga Cir Unit 11
- 10804 W Saratoga Cir
- 10804 W Sarabande Cir