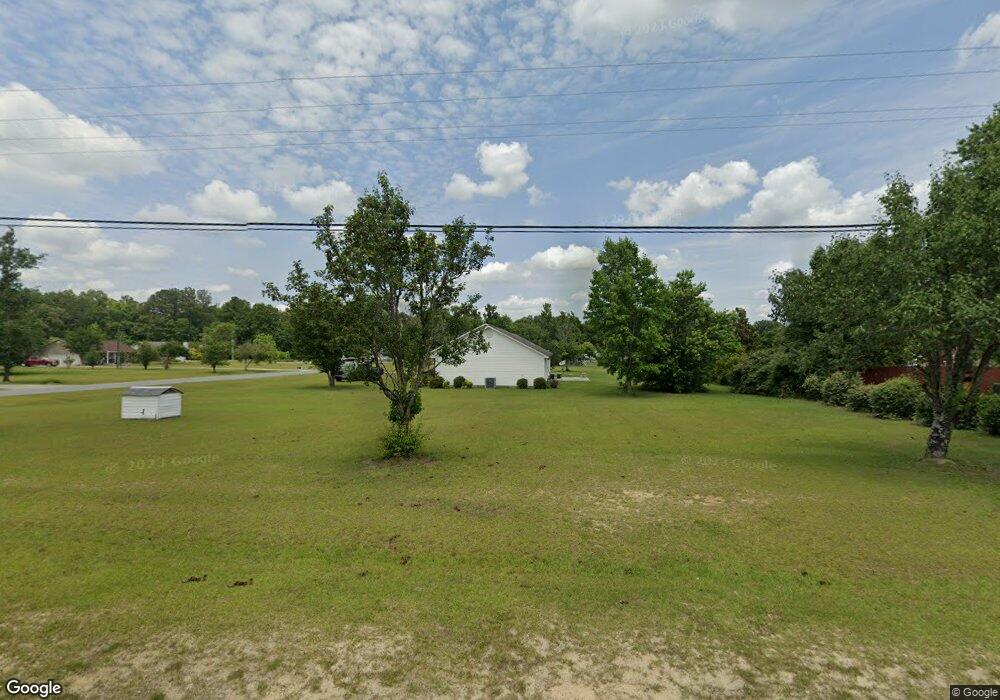
1081 Blackshear Ferry Rd W Dublin, GA 31021
Estimated Value: $231,105 - $302,000
--
Bed
2
Baths
1,949
Sq Ft
$134/Sq Ft
Est. Value
About This Home
This home is located at 1081 Blackshear Ferry Rd W, Dublin, GA 31021 and is currently estimated at $260,526, approximately $133 per square foot. 1081 Blackshear Ferry Rd W is a home located in Laurens County with nearby schools including Northwest Laurens Elementary School, Southwest Laurens Elementary School, and East Laurens Primary School.
Ownership History
Date
Name
Owned For
Owner Type
Purchase Details
Closed on
Jan 8, 2014
Sold by
Harris Lucille P
Bought by
Nesmith Angel S
Current Estimated Value
Home Financials for this Owner
Home Financials are based on the most recent Mortgage that was taken out on this home.
Original Mortgage
$108,007
Outstanding Balance
$81,099
Interest Rate
4.25%
Mortgage Type
FHA
Estimated Equity
$179,427
Purchase Details
Closed on
Dec 8, 2012
Sold by
Harris William Ray
Bought by
Collett Billie Jean Harris and Kaminski Regina R Harris
Purchase Details
Closed on
Oct 5, 1998
Sold by
Harrell Johnny
Bought by
Harris William R
Purchase Details
Closed on
Jul 10, 1998
Sold by
Parrish Development
Bought by
Harrell Johnny
Purchase Details
Closed on
Sep 23, 1996
Sold by
Pope Sheila and Pope Jones
Bought by
Parrish Development
Create a Home Valuation Report for This Property
The Home Valuation Report is an in-depth analysis detailing your home's value as well as a comparison with similar homes in the area
Home Values in the Area
Average Home Value in this Area
Purchase History
| Date | Buyer | Sale Price | Title Company |
|---|---|---|---|
| Nesmith Angel S | $110,000 | -- | |
| Collett Billie Jean Harris | -- | -- | |
| Harris William R | $90,000 | -- | |
| Harrell Johnny | $7,400 | -- | |
| Parrish Development | -- | -- |
Source: Public Records
Mortgage History
| Date | Status | Borrower | Loan Amount |
|---|---|---|---|
| Open | Nesmith Angel S | $108,007 |
Source: Public Records
Tax History Compared to Growth
Tax History
| Year | Tax Paid | Tax Assessment Tax Assessment Total Assessment is a certain percentage of the fair market value that is determined by local assessors to be the total taxable value of land and additions on the property. | Land | Improvement |
|---|---|---|---|---|
| 2024 | $1,461 | $69,416 | $8,000 | $61,416 |
| 2023 | $1,337 | $62,967 | $8,000 | $54,967 |
| 2022 | $1,387 | $62,967 | $8,000 | $54,967 |
| 2021 | $1,000 | $43,569 | $4,400 | $39,169 |
| 2020 | $1,001 | $43,569 | $4,400 | $39,169 |
| 2019 | $1,002 | $43,569 | $4,400 | $39,169 |
| 2018 | $1,003 | $43,569 | $4,400 | $39,169 |
| 2017 | $1,002 | $43,569 | $4,400 | $39,169 |
| 2016 | $1,003 | $43,569 | $4,400 | $39,169 |
| 2015 | $1,003 | $43,569 | $4,400 | $39,169 |
| 2014 | $828 | $34,679 | $3,230 | $31,449 |
Source: Public Records
Map
Nearby Homes
- 1940 Barrington Dr
- 00 Lexington Dr
- 235 Strawberry Cir
- 618 Gordon Edwards Rd
- 0 Gordon Edwards Rd Unit 27918
- 0 Flanders Ct N Unit 30069
- 0 Flanders Ct N Unit 10554837
- 0 Flanders Ct N Unit 29123
- 603 Old Toomsboro Rd
- 0 Cameron Ct
- 0 Woodland Heights Rd Unit 29127
- 0 Woodland Heights Rd Unit 29121
- 0 Woodland Heights Rd Unit 29120
- 0 Woodland Heights Rd Unit 21231
- 168 Woodland Heights Rd
- 11 Creekwood Dr
- 719 Jones Ln
- 0 Woodland Trail Unit 22343
- 0 Woodland Trail Unit 22344
- 311 Holly Dr
- 1081 Blackshear Ferry Rd W
- 1077 Blackshear Ferry Rd W
- 1077 Blackshear Ferry Rd W
- 152 Blackshears Cir
- 155 Blackshear Ferry Cir
- 155 Blackshears Cir
- 0 Blackshear Ferry
- 1073 Blackshear Ferry Rd W
- 1073 Blackshear Ferry Rd W
- 154 Blackshears Cir
- 154 Blackshear Ferry Cir
- 163 Blackshear Ferry Cir
- 163 Blackshears Cir
- 1069 Blackshear Ferry Rd W
- 165 Blackshear Ferry Cir
- 158 Blackshear Ferry Cir
- 165 Blackshears Cir
- 158 Blackshears Cir
- 156 Blackshears Cir
- 160 Blackshear Ferry Cir