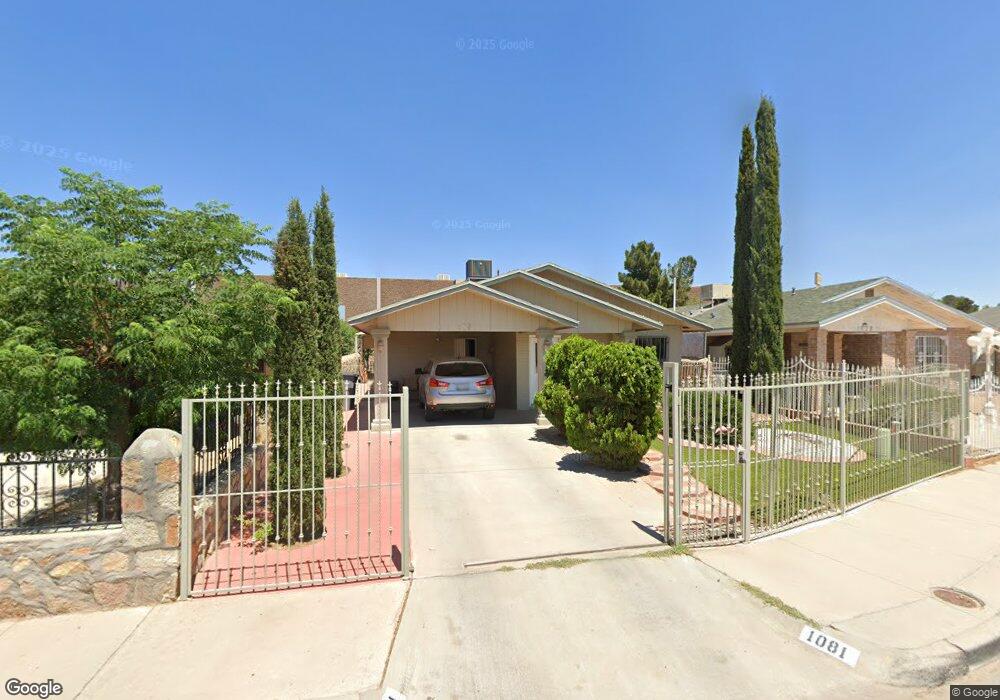
1081 Green Lilac Cir El Paso, TX 79915
Santa Lucia NeighborhoodEstimated Value: $152,000 - $159,922
3
Beds
2
Baths
945
Sq Ft
$164/Sq Ft
Est. Value
About This Home
This home is located at 1081 Green Lilac Cir, El Paso, TX 79915 and is currently estimated at $154,981, approximately $164 per square foot. 1081 Green Lilac Cir is a home located in El Paso County with nearby schools including North Loop Elementary School, Bel Air Middle, and Bel Air High School.
Ownership History
Date
Name
Owned For
Owner Type
Purchase Details
Closed on
Oct 2, 2024
Sold by
Gutierrez Soraya Chico
Bought by
Gutierrez Soraya Chico and Loaiza Adrian
Current Estimated Value
Purchase Details
Closed on
Feb 28, 2023
Sold by
Gutierrez Ramon
Bought by
Given Not
Purchase Details
Closed on
Jun 24, 2002
Sold by
Corral Diana
Bought by
Gutierrez Ramon and Gutierrez Manuela
Home Financials for this Owner
Home Financials are based on the most recent Mortgage that was taken out on this home.
Original Mortgage
$55,504
Interest Rate
6.78%
Mortgage Type
FHA
Purchase Details
Closed on
Sep 5, 2000
Sold by
Sanchez Leonel
Bought by
Corral Diana
Purchase Details
Closed on
Dec 30, 1996
Sold by
Tropicana Homes Inc
Bought by
Miranda Teodora
Home Financials for this Owner
Home Financials are based on the most recent Mortgage that was taken out on this home.
Original Mortgage
$42,000
Interest Rate
7.53%
Create a Home Valuation Report for This Property
The Home Valuation Report is an in-depth analysis detailing your home's value as well as a comparison with similar homes in the area
Home Values in the Area
Average Home Value in this Area
Purchase History
| Date | Buyer | Sale Price | Title Company |
|---|---|---|---|
| Gutierrez Soraya Chico | -- | None Listed On Document | |
| Given Not | -- | -- | |
| Gutierrez Ramon | -- | -- | |
| Corral Diana | -- | -- | |
| Miranda Teodora | -- | -- |
Source: Public Records
Mortgage History
| Date | Status | Borrower | Loan Amount |
|---|---|---|---|
| Previous Owner | Gutierrez Ramon | $55,504 | |
| Previous Owner | Miranda Teodora | $42,000 |
Source: Public Records
Tax History Compared to Growth
Tax History
| Year | Tax Paid | Tax Assessment Tax Assessment Total Assessment is a certain percentage of the fair market value that is determined by local assessors to be the total taxable value of land and additions on the property. | Land | Improvement |
|---|---|---|---|---|
| 2025 | $1,237 | $151,365 | $29,689 | $121,676 |
| 2024 | $1,237 | $113,281 | -- | -- |
| 2023 | $1,162 | $102,983 | $0 | $0 |
| 2022 | $2,907 | $93,621 | $0 | $0 |
| 2021 | $2,767 | $96,249 | $12,436 | $83,813 |
| 2020 | $2,444 | $77,373 | $12,436 | $64,937 |
| 2018 | $2,350 | $75,563 | $12,436 | $63,127 |
| 2017 | $2,286 | $74,772 | $12,436 | $62,336 |
| 2016 | $2,286 | $74,772 | $12,436 | $62,336 |
| 2015 | $988 | $74,772 | $12,436 | $62,336 |
| 2014 | $988 | $75,497 | $12,436 | $63,061 |
Source: Public Records
Map
Nearby Homes
- 7937 San Paulo Dr
- 7928 Hermosillo Dr
- 7921 Lirio Rd
- 7909 La Jolla Dr
- 525 Lafayette Dr
- 537 Emerson St
- 7800 Hermosillo Dr
- 8004 Gilbert Dr
- 812 Santa Barbara Dr
- 7975 Esther Rd
- 1121 Stanley St
- 844 Santa Barbara Dr
- 7655 Hacienda Ave
- 740 Draco Place
- 405 Lafayette Dr
- 7922 Parral Dr
- 1004 Atwood Dr
- 7718 Parral Dr
- 7832 Ranchland Dr
- 7713 Matamoros Dr
- 1083 Green Lilac Cir
- 1079 Green Lilac Cir Unit 1
- 1085 Green Lilac Cir
- 1077 Green Lilac Cir
- 1072 Green Lilac Cir
- 1087 Green Lilac Cir
- 1087 Green Lilac Cur Cir
- 1075 Green Lilac Cir
- 1019 Green Lilac Cir
- 1070 Green Lilac Cir
- 1073 Green Lilac Cir
- 1021 Green Lilac Cir
- 1071 Green Lilac Cir
- 1068 Green Lilac Cir
- 1069 Green Lilac Cir
- 656 Rancho Alegre Way
- 1023 Green Lilac Cir
- 1066 Green Lilac Cir
- 1067 Green Lilac Cir
- 1020 Green Lilac Cir