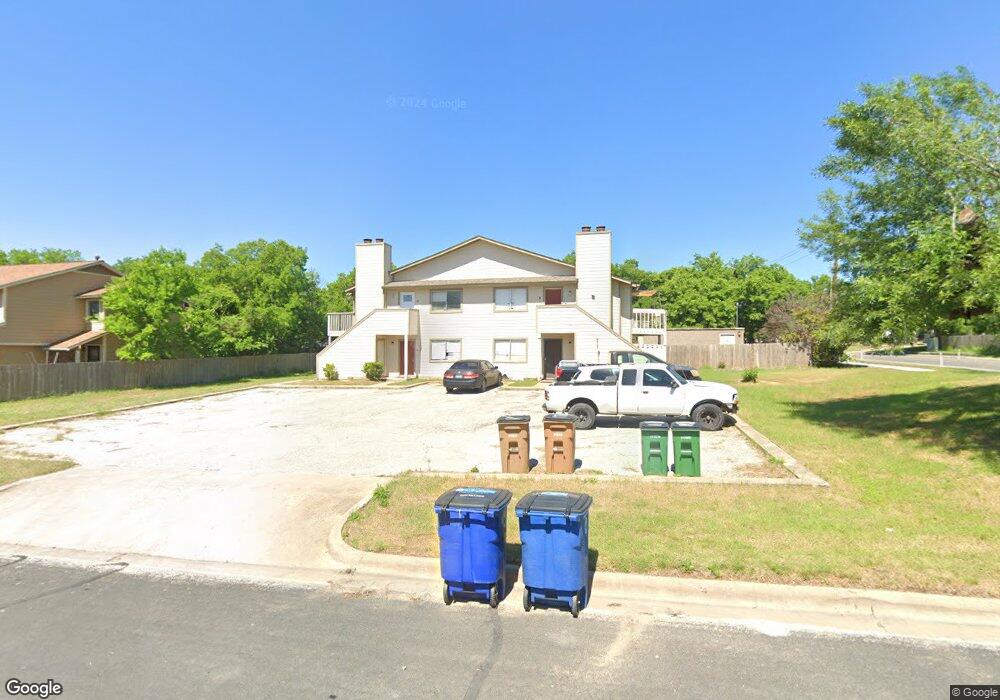
10810 Lanshire Dr Unit C Austin, TX 78758
North Austin NeighborhoodEstimated Value: $594,000
2
Beds
1
Bath
3,876
Sq Ft
$153/Sq Ft
Est. Value
About This Home
This home is located at 10810 Lanshire Dr Unit C, Austin, TX 78758 and is currently estimated at $594,000, approximately $153 per square foot. 10810 Lanshire Dr Unit C is a home located in Travis County with nearby schools including Cook Elementary School, Burnet Middle School, and Navarro Early College High School.
Ownership History
Date
Name
Owned For
Owner Type
Purchase Details
Closed on
Dec 8, 2011
Sold by
Fa Group Llc
Bought by
Yu David and Lin Katherine
Current Estimated Value
Purchase Details
Closed on
Dec 27, 2010
Sold by
Yu David and Lin Katherine
Bought by
Fa Group Llc
Purchase Details
Closed on
Sep 21, 2007
Sold by
Molina Jorge E
Bought by
Yu David and Lin Katherine
Home Financials for this Owner
Home Financials are based on the most recent Mortgage that was taken out on this home.
Original Mortgage
$174,000
Interest Rate
6.55%
Mortgage Type
Purchase Money Mortgage
Purchase Details
Closed on
Jul 6, 1998
Sold by
Cawthon David Britt
Bought by
Molina Jorge E
Home Financials for this Owner
Home Financials are based on the most recent Mortgage that was taken out on this home.
Original Mortgage
$127,200
Interest Rate
7.09%
Mortgage Type
Purchase Money Mortgage
Create a Home Valuation Report for This Property
The Home Valuation Report is an in-depth analysis detailing your home's value as well as a comparison with similar homes in the area
Home Values in the Area
Average Home Value in this Area
Purchase History
| Date | Buyer | Sale Price | Title Company |
|---|---|---|---|
| Yu David | -- | None Available | |
| Fa Group Llc | -- | None Available | |
| Yu David | -- | None Available | |
| Molina Jorge E | -- | Heart Of Texas Title |
Source: Public Records
Mortgage History
| Date | Status | Borrower | Loan Amount |
|---|---|---|---|
| Previous Owner | Yu David | $174,000 | |
| Previous Owner | Molina Jorge E | $127,200 | |
| Closed | Fa Group Llc | $0 |
Source: Public Records
Tax History Compared to Growth
Tax History
| Year | Tax Paid | Tax Assessment Tax Assessment Total Assessment is a certain percentage of the fair market value that is determined by local assessors to be the total taxable value of land and additions on the property. | Land | Improvement |
|---|---|---|---|---|
| 2025 | $13,708 | $639,262 | $245,444 | $393,818 |
| 2023 | $11,361 | $627,960 | $302,500 | $325,460 |
| 2022 | $14,433 | $730,834 | $302,500 | $428,334 |
| 2021 | $11,785 | $541,430 | $137,500 | $403,930 |
| 2020 | $10,118 | $471,721 | $137,500 | $334,221 |
| 2018 | $9,898 | $447,089 | $137,500 | $309,589 |
| 2017 | $8,536 | $348,956 | $82,500 | $266,456 |
| 2016 | $8,256 | $360,097 | $66,000 | $294,097 |
| 2015 | $4,981 | $220,124 | $35,000 | $185,124 |
| 2014 | $4,981 | $211,520 | $35,000 | $176,520 |
Source: Public Records
Map
Nearby Homes
- 11106 Ptarmigan Dr
- 1737 Cricket Hollow Dr
- 10717 Desert Trail
- 1768 Cricket Hollow Dr
- 1712 Pine Knoll Dr
- 1503 Cricket Hollow Dr
- 1501 Cricket Hollow Dr
- 1810 Mearns Meadow Blvd Unit A & B
- 10815 Hermosillo Dr
- 10821 Desert Trail
- 10414 Quail Ridge Dr
- 11414 Ptarmigan Dr
- 11411 Ptarmigan Dr Unit 1
- 10410 Quail Ridge Dr
- 11421 Ptarmigan Dr Unit 1
- 11419 Ptarmigan Dr Unit 1
- 1618 Cripple Creek Dr
- 11501 Hidden Quail Dr
- 11500 Ruffed Grouse Dr
- 1903 Golden Pheasant Dr
- 10810 Lanshire Dr Unit A Dr
- 10810 Lanshire Dr Unit B
- 10810 Lanshire Dr
- 10810 Lanshire Unit A Dr
- 10808 Lanshire Dr
- 10806 Lanshire Dr Unit B
- 10806 Lanshire Dr
- 10811 Lanshire Dr Unit A
- 10811 Lanshire Dr Unit D
- 10811 Lanshire Dr Unit B
- 10811 Lanshire Dr Unit C
- 10811 Lanshire Dr
- 11006 Prairie Dove Cir
- 10809 Lanshire Dr
- 10809 Lanshire Dr Unit B
- 11004 Prairie Dove Cir
- 10804 Lanshire Dr
- 10807 Lanshire Dr
- 11002 Prairie Dove Cir
- 11008 Prairie Dove Cir