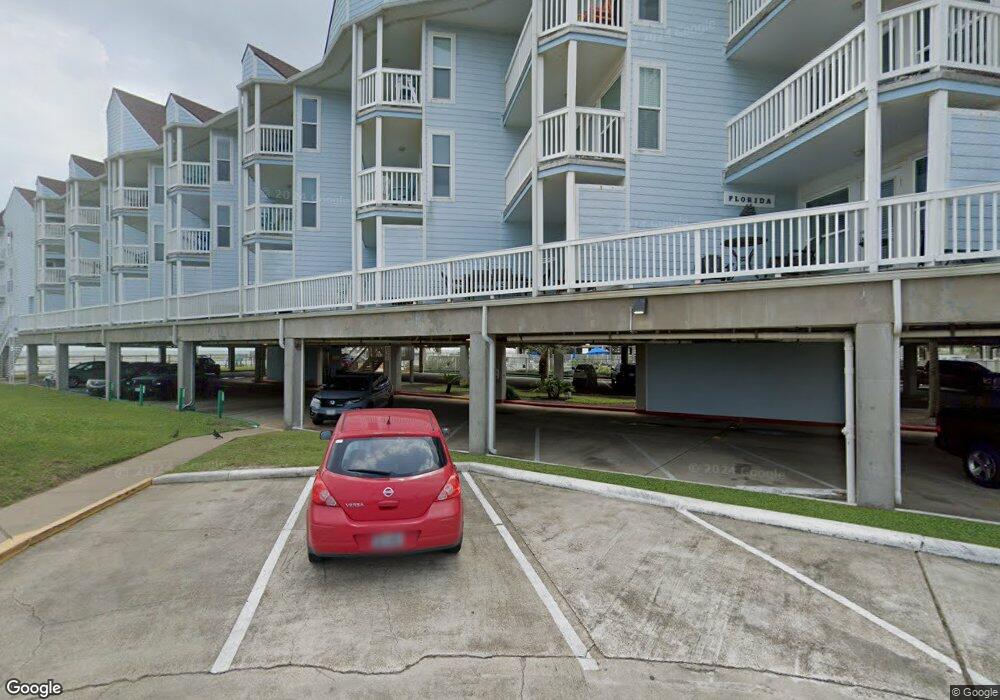
Seascape Resort Beachfront Condos 10811 Termini San Luis Pass Rd Unit 2120 Galveston, TX 77554
Spanish Grant-Beachside Village-Evia NeighborhoodEstimated Value: $244,219 - $271,000
1
Bed
1
Bath
513
Sq Ft
$508/Sq Ft
Est. Value
About This Home
This home is located at 10811 Termini San Luis Pass Rd Unit 2120, Galveston, TX 77554 and is currently estimated at $260,805, approximately $508 per square foot. 10811 Termini San Luis Pass Rd Unit 2120 is a home located in Galveston County with nearby schools including Oppe Elementary School, Parker Elementary School, and Burnet STREAM Magnet School.
Ownership History
Date
Name
Owned For
Owner Type
Purchase Details
Closed on
Sep 28, 2017
Sold by
Sawyer Timothy J
Bought by
Ashe Richrd C and Ashe Shannon B
Current Estimated Value
Purchase Details
Closed on
Nov 12, 2004
Sold by
Adkison Herbert and Adkison Marla
Bought by
Skeete Yolanda C
Home Financials for this Owner
Home Financials are based on the most recent Mortgage that was taken out on this home.
Original Mortgage
$67,050
Interest Rate
4.87%
Purchase Details
Closed on
Oct 3, 2003
Sold by
Boatman Charles E and Boatman Delores
Bought by
Rutherford Kenny D and Rutherford Davida R
Purchase Details
Closed on
Sep 13, 2000
Sold by
Bank Atlantic Fsb
Bought by
Adkison Herbert and Adkison Marla
Home Financials for this Owner
Home Financials are based on the most recent Mortgage that was taken out on this home.
Original Mortgage
$27,900
Interest Rate
8.01%
Create a Home Valuation Report for This Property
The Home Valuation Report is an in-depth analysis detailing your home's value as well as a comparison with similar homes in the area
Home Values in the Area
Average Home Value in this Area
Purchase History
| Date | Buyer | Sale Price | Title Company |
|---|---|---|---|
| Ashe Richrd C | -- | None Available | |
| Skeete Yolanda C | -- | South Land Title Company | |
| Rutherford Kenny D | -- | Texas American Title Company | |
| Adkison Herbert | -- | Chicago Title |
Source: Public Records
Mortgage History
| Date | Status | Borrower | Loan Amount |
|---|---|---|---|
| Previous Owner | Skeete Yolanda C | $67,050 | |
| Previous Owner | Adkison Herbert | $27,900 |
Source: Public Records
Tax History Compared to Growth
Tax History
| Year | Tax Paid | Tax Assessment Tax Assessment Total Assessment is a certain percentage of the fair market value that is determined by local assessors to be the total taxable value of land and additions on the property. | Land | Improvement |
|---|---|---|---|---|
| 2025 | $4,740 | $257,700 | $13,290 | $244,410 |
| 2024 | $4,740 | $277,740 | $13,290 | $264,450 |
| 2023 | $4,740 | $241,250 | $12,768 | $228,482 |
| 2022 | $4,480 | $225,400 | $13,290 | $212,110 |
| 2021 | $4,106 | $184,850 | $13,290 | $171,560 |
| 2020 | $3,981 | $169,250 | $13,290 | $155,960 |
| 2019 | $3,751 | $154,820 | $13,290 | $141,530 |
| 2018 | $3,218 | $132,210 | $13,290 | $118,920 |
| 2017 | $3,177 | $132,210 | $13,290 | $118,920 |
| 2016 | $3,177 | $132,195 | $13,285 | $118,910 |
| 2015 | $2,928 | $120,505 | $13,285 | $107,220 |
| 2014 | $2,965 | $97,105 | $13,285 | $83,820 |
Source: Public Records
About Seascape Resort Beachfront Condos
Map
Nearby Homes
- 10811 Termini-San Luis Pass Rd Unit 1214
- 10811 Termini San Luis Pass Rd
- 10811 San Luis Pass Rd Unit 1214
- 10811 Termini San Luis Pass Rd Unit 2112
- 10811 San Luis Pass Rd Unit 1121
- 10811 Termini-San Luis Pass Rd Unit 1314
- 10811 San Luis Pass Rd Unit 1318
- 10811 San Luis Pass Rd Unit 2320
- 10811 San Luis Pass Rd Unit 1216
- 10811 San Luis Pass Rd Unit 1201
- 10811 San Luis Pass Rd Unit 1213
- 10811 Termini-San Luis Pass Rd Unit 2303
- 10811 San Luis Pass Rd Unit 2301
- 10811 San Luis Pass Rd Unit 1315
- 10811 Termini San Luis Pass Rd Unit 1101
- 10811 Termini San Luis Pass Rd Unit 2123
- 11010 1/2 Termini-San Luis Pass Rd
- 10327 San Luis Pass Rd Unit 413
- 10327 Termini San Luis Pass Rd Unit 611
- 10327 Termini San Luis Pass Rd Unit 609
- 10811 Termini San Luis Pass Rd Unit 2202
- 10811 Termini San Luis Pass Rd Unit 1315
- 10811 San Luis Pass Rd Unit 2205
- 10811 Termini-San Luis Pass Rd
- 10811 Termini San Luis Pass Rd Unit Sea Villa
- 10811 San Luis Pass Rd Unit 2319
- 10811 San Luis Pass Rd Unit 1118
- 10811 San Luis Pass Rd Unit 2307
- 10811 Termini San Luis Pass Rd Unit 1312
- 10811 Termini San Luis Pass Rd Unit 1108
- 10811 San Luis Pass Rd Unit 2202
- 10811 Termini San Luis Pass Rd Unit 2213
- 10811 San Luis Pass Rd Unit 1117
- 10811 Termini-San Luis Pass Rd Unit 2119
- 10811 San Luis Pass Rd Unit 2213
- 10811 Termini San Luis Pass Rd Unit 2303
- 10811 Termini-San Luis Pass Rd Unit 1213
- 10811 San Luis Pass Rd Unit 2101
- 10811 San Luis Pass Rd Unit 1307
- 10811 Termini-San Luis Pass Rd Unit 2117