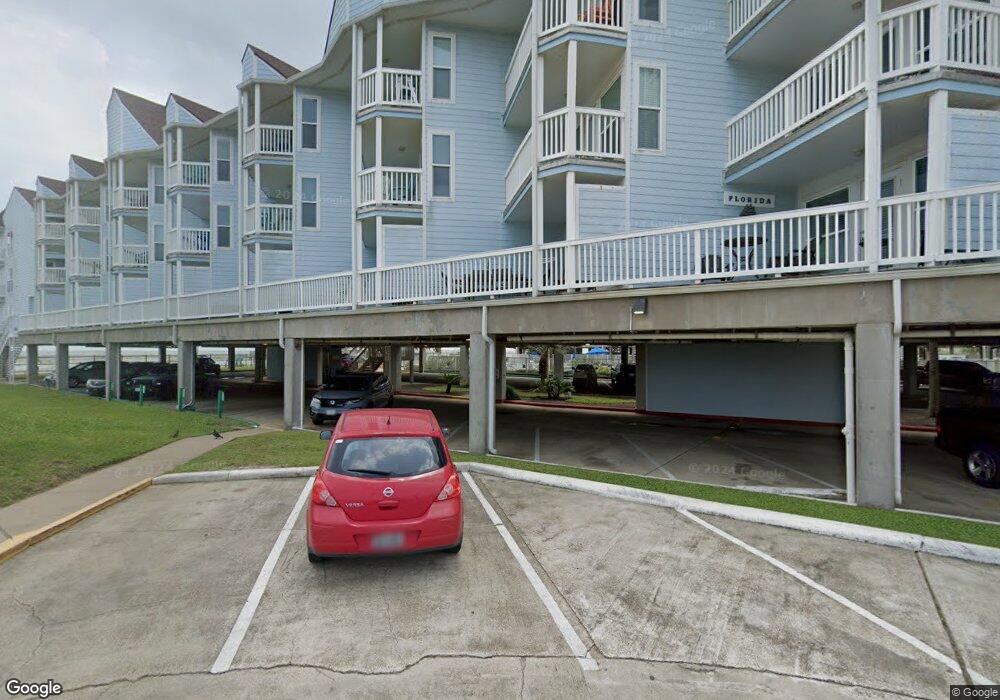
Seascape Resort Beachfront Condos 10811 Termini San Luis Pass Rd Unit 2301 Galveston, TX 77554
Spanish Grant-Beachside Village-Evia NeighborhoodEstimated Value: $445,000 - $460,000
2
Beds
2
Baths
759
Sq Ft
$598/Sq Ft
Est. Value
About This Home
This home is located at 10811 Termini San Luis Pass Rd Unit 2301, Galveston, TX 77554 and is currently estimated at $454,209, approximately $598 per square foot. 10811 Termini San Luis Pass Rd Unit 2301 is a home located in Galveston County with nearby schools including Oppe Elementary School, Parker Elementary School, and Burnet STREAM Magnet School.
Ownership History
Date
Name
Owned For
Owner Type
Purchase Details
Closed on
Apr 13, 2012
Sold by
Bailey Ronald M and Bailey Waverly D
Bought by
Caldwell D L
Current Estimated Value
Purchase Details
Closed on
Apr 13, 2007
Sold by
Volk Kenneth J and Volk Monica C
Bought by
Bailey Ronald M and Bailey Waverly D
Home Financials for this Owner
Home Financials are based on the most recent Mortgage that was taken out on this home.
Original Mortgage
$184,500
Interest Rate
6.19%
Mortgage Type
Purchase Money Mortgage
Purchase Details
Closed on
Aug 22, 2003
Sold by
Best Anthony J and Best Gloria J
Bought by
Volk Kenneth J and Volk Monica C
Home Financials for this Owner
Home Financials are based on the most recent Mortgage that was taken out on this home.
Original Mortgage
$85,000
Interest Rate
5.71%
Mortgage Type
Purchase Money Mortgage
Create a Home Valuation Report for This Property
The Home Valuation Report is an in-depth analysis detailing your home's value as well as a comparison with similar homes in the area
Home Values in the Area
Average Home Value in this Area
Purchase History
| Date | Buyer | Sale Price | Title Company |
|---|---|---|---|
| Caldwell D L | -- | Chicago Title | |
| Bailey Ronald M | -- | Chicago Title | |
| Volk Kenneth J | -- | Chicago Title |
Source: Public Records
Mortgage History
| Date | Status | Borrower | Loan Amount |
|---|---|---|---|
| Previous Owner | Bailey Ronald M | $184,500 | |
| Previous Owner | Volk Kenneth J | $85,000 |
Source: Public Records
Tax History Compared to Growth
Tax History
| Year | Tax Paid | Tax Assessment Tax Assessment Total Assessment is a certain percentage of the fair market value that is determined by local assessors to be the total taxable value of land and additions on the property. | Land | Improvement |
|---|---|---|---|---|
| 2025 | $6,265 | $381,250 | $19,660 | $361,590 |
| 2024 | $6,265 | $410,930 | $19,660 | $391,270 |
| 2023 | $6,265 | $371,540 | $19,660 | $351,880 |
| 2022 | $6,628 | $250,000 | $19,660 | $230,340 |
| 2021 | $6,075 | $273,470 | $19,660 | $253,810 |
| 2020 | $5,347 | $227,308 | $19,660 | $207,648 |
| 2019 | $5,550 | $229,040 | $19,660 | $209,380 |
| 2018 | $4,761 | $195,580 | $19,660 | $175,920 |
| 2017 | $4,700 | $195,580 | $19,660 | $175,920 |
| 2016 | $4,701 | $195,595 | $19,655 | $175,940 |
| 2015 | $4,332 | $178,285 | $19,655 | $158,630 |
| 2014 | $4,387 | $103,005 | $19,655 | $83,350 |
Source: Public Records
About Seascape Resort Beachfront Condos
Map
Nearby Homes
- 10811 Termini San Luis Pass Rd
- 10811 Termini San Luis Pass Rd Unit 2112
- 10811 Termini-San Luis Pass Rd Unit 1314
- 10811 San Luis Pass Rd Unit 1118
- 10811 San Luis Pass Rd Unit 1318
- 10811 San Luis Pass Rd Unit 1121
- 10811 San Luis Pass Rd Unit 2320
- 10811 San Luis Pass Rd Unit 1216
- 10811 San Luis Pass Rd Unit 1201
- 10811 San Luis Pass Rd Unit 1213
- 10811 Termini-San Luis Pass Rd Unit 2303
- 10811 San Luis Pass Rd Unit 2301
- 10811 San Luis Pass Rd Unit 1315
- 10811 Termini San Luis Pass Rd Unit 1101
- 10811 Termini San Luis Pass Rd Unit 2123
- 10525 Termini-San Luis Pass Rd Unit 1001
- 11010 1/2 Termini-San Luis Pass Rd
- 10327 San Luis Pass Rd Unit 413
- 10327 Termini San Luis Pass Rd Unit 611
- 10327 Termini San Luis Pass Rd Unit 517
- 10811 Termini-San Luis Pass Rd
- 10811 Termini San Luis Pass Rd Unit Sea Villa
- 10811 San Luis Pass Rd Unit 2319
- 10811 Termini San Luis Pass Rd Unit 2120
- 10811 Termini San Luis Pass Rd Unit 1312
- 10811 Termini San Luis Pass Rd Unit 1108
- 10811 Termini San Luis Pass Rd Unit 2213
- 10811 San Luis Pass Rd Unit 1117
- 10811 Termini-San Luis Pass Rd Unit 2119
- 10811 San Luis Pass Rd Unit 2213
- 10811 Termini San Luis Pass Rd Unit 2303
- 10811 Termini-San Luis Pass Rd Unit 1213
- 10811 San Luis Pass Rd Unit 2101
- 10811 San Luis Pass Rd Unit 1307
- 10811 Termini-San Luis Pass Rd Unit 2117
- 10811 Fm 3005 Rd Unit 2321
- 10811 San Luis Pass Rd Unit 1319
- 10811 San Luis Pass Rd Unit 2322
- 10811 San Luis Pass Rd Unit 2203
- 10811 San Luis Pass Rd Unit 2323