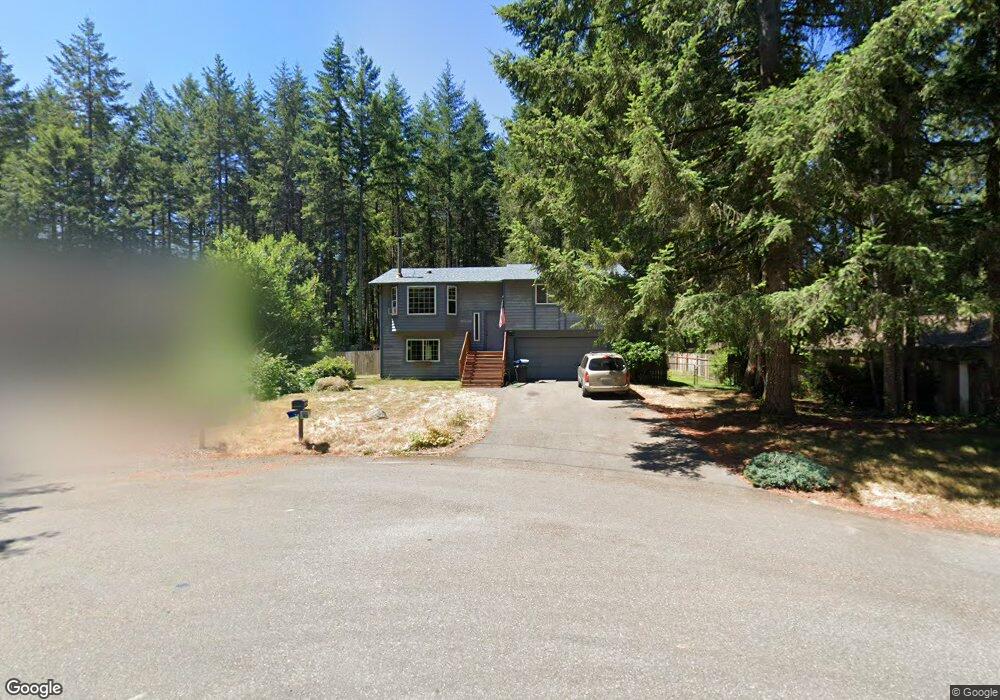
10814 Little Tree Place SW Port Orchard, WA 98367
Estimated Value: $477,038 - $584,000
3
Beds
2
Baths
1,106
Sq Ft
$465/Sq Ft
Est. Value
About This Home
This home is located at 10814 Little Tree Place SW, Port Orchard, WA 98367 and is currently estimated at $514,760, approximately $465 per square foot. 10814 Little Tree Place SW is a home located in Kitsap County with nearby schools including Burley Glenwood Elementary School, Cedar Heights Middle School, and South Kitsap High School.
Ownership History
Date
Name
Owned For
Owner Type
Purchase Details
Closed on
Sep 11, 2000
Sold by
Stamper Thomas A and Stamper Dorothy
Bought by
Gronberg Christopher M and Gronberg Bridget C
Current Estimated Value
Home Financials for this Owner
Home Financials are based on the most recent Mortgage that was taken out on this home.
Original Mortgage
$126,322
Outstanding Balance
$46,072
Interest Rate
8.11%
Mortgage Type
FHA
Estimated Equity
$468,688
Purchase Details
Closed on
Aug 5, 1997
Sold by
Stamper Dorothy L
Bought by
Stamper Thomas A
Purchase Details
Closed on
Nov 30, 1994
Sold by
Daberkoe Daniel M and Daberkoe Tracy L
Bought by
Hampton Clifford E and Hampton Sandra K
Home Financials for this Owner
Home Financials are based on the most recent Mortgage that was taken out on this home.
Original Mortgage
$124,440
Interest Rate
8.9%
Mortgage Type
Assumption
Create a Home Valuation Report for This Property
The Home Valuation Report is an in-depth analysis detailing your home's value as well as a comparison with similar homes in the area
Home Values in the Area
Average Home Value in this Area
Purchase History
| Date | Buyer | Sale Price | Title Company |
|---|---|---|---|
| Gronberg Christopher M | $128,000 | Pacific Nw Title | |
| Stamper Thomas A | -- | Pacific Nw Title | |
| Stamper Thomas A | $125,000 | Pacific Nw Title | |
| Hampton Clifford E | $122,000 | Stewart Title Co |
Source: Public Records
Mortgage History
| Date | Status | Borrower | Loan Amount |
|---|---|---|---|
| Open | Gronberg Christopher M | $126,322 | |
| Previous Owner | Hampton Clifford E | $124,440 |
Source: Public Records
Tax History Compared to Growth
Tax History
| Year | Tax Paid | Tax Assessment Tax Assessment Total Assessment is a certain percentage of the fair market value that is determined by local assessors to be the total taxable value of land and additions on the property. | Land | Improvement |
|---|---|---|---|---|
| 2026 | $3,698 | $419,520 | $79,050 | $340,470 |
| 2025 | $3,698 | $419,520 | $79,050 | $340,470 |
| 2024 | $3,587 | $419,520 | $79,050 | $340,470 |
| 2023 | $3,563 | $419,520 | $79,050 | $340,470 |
| 2022 | $3,409 | $336,050 | $63,010 | $273,040 |
| 2021 | $3,242 | $302,360 | $57,280 | $245,080 |
| 2020 | $2,857 | $257,800 | $56,230 | $201,570 |
| 2019 | $2,421 | $239,140 | $51,970 | $187,170 |
| 2018 | $2,563 | $193,140 | $44,730 | $148,410 |
| 2017 | $2,155 | $193,140 | $44,730 | $148,410 |
| 2016 | $2,118 | $173,680 | $42,600 | $131,080 |
| 2015 | $2,049 | $170,310 | $42,600 | $127,710 |
| 2014 | -- | $167,440 | $42,620 | $124,820 |
| 2013 | -- | $167,440 | $42,620 | $124,820 |
Source: Public Records
Map
Nearby Homes
- 11291 Cooper Ave SW
- 10574 Sidney Rd SW
- 514 SW Hipkins Ct
- 11618 Sidney Rd SW
- 453 SW View Dr
- 11676 Fry Ave SW
- 10088 Fairview Blvd SW
- 11255 Ridge Rim Trail SE
- 10966 Branch Place SE
- 9504 SW Caulfield Ln
- 10223 Glenwood Rd SW
- 10569 Glenwood Rd SW
- 10668 Bethel Burley Rd SE
- 10379 Bethel Burley Rd SE
- 959 SE Spencer Ave
- 8840 Conwhit Ln SW
- 8718 Sidney Rd SW
- 0 Silver Ln SW
- 12524 Westbrook Dr SW
- 700 SW Black Jack Ln
- 10818 Little Tree Place SW
- 10810 Little Tree Place SW
- 10821 Little Tree Place SW
- 10800 Little Tree Place SW
- 10817 Little Tree Place SW
- 10813 Little Tree Place SW
- 10809 Little Tree Place SW
- 10801 Little Tree Place SW
- 10805 Little Tree Place SW
- 3 Lot C SW Windy Way
- 1 Lot A SW Windy Way
- 2 Lot B SW Windy Way
- 4 Lot D SW Windy Way
- 788 SW Little Tree Cir
- 788 SW Littletree Cir
- 800 SW Little Tree Cir
- 686 SW Windy Way
- 10909 Sidney Rd SW
- 776 SW Little Tree Cir
- 602 SW Windy Way