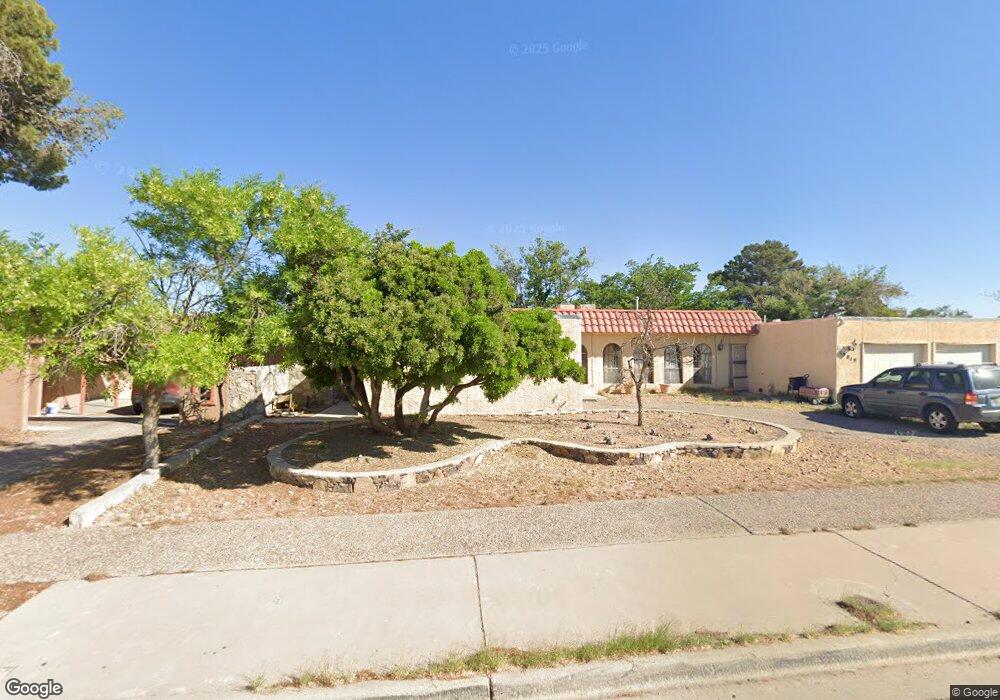
10817 Ivanhoe Dr Unit 10819 El Paso, TX 79935
Pebble Hills NeighborhoodEstimated Value: $132,000 - $150,000
2
Beds
2
Baths
872
Sq Ft
$164/Sq Ft
Est. Value
About This Home
This home is located at 10817 Ivanhoe Dr Unit 10819, El Paso, TX 79935 and is currently estimated at $142,963, approximately $163 per square foot. 10817 Ivanhoe Dr Unit 10819 is a home located in El Paso County with nearby schools including Robbin E L Washington Elementary School, J M Hanks High School, and New World Montessori School.
Create a Home Valuation Report for This Property
The Home Valuation Report is an in-depth analysis detailing your home's value as well as a comparison with similar homes in the area
Home Values in the Area
Average Home Value in this Area
Tax History Compared to Growth
Tax History
| Year | Tax Paid | Tax Assessment Tax Assessment Total Assessment is a certain percentage of the fair market value that is determined by local assessors to be the total taxable value of land and additions on the property. | Land | Improvement |
|---|---|---|---|---|
| 2025 | $2,774 | $140,000 | $36,613 | $103,387 |
| 2024 | $2,774 | $101,000 | $14,726 | $86,274 |
| 2023 | $3,385 | $116,317 | $14,726 | $101,591 |
| 2022 | $3,336 | $107,418 | $14,726 | $92,692 |
| 2021 | $2,670 | $82,149 | $14,726 | $67,423 |
| 2020 | $2,292 | $72,568 | $12,574 | $59,994 |
| 2018 | $2,257 | $72,568 | $12,574 | $59,994 |
| 2017 | $2,182 | $71,389 | $12,574 | $58,815 |
| 2016 | $2,182 | $71,389 | $12,574 | $58,815 |
| 2015 | $2,043 | $71,389 | $12,574 | $58,815 |
| 2014 | $2,043 | $71,389 | $12,574 | $58,815 |
Source: Public Records
Map
Nearby Homes
- 10649 Islerock Dr
- 3200 Voss Dr
- 3324 Kilgore Place
- 3229 E Glen Dr
- 3112 Eads Place
- 3369 Freeport Dr
- 10712 Gay Brewer Dr
- 10605 Kinross Ave Unit B
- 3319 Menard Ln
- 3108 3108 Rock Wall Ln Tx Ln
- 3400 Brookrock St
- 2820 Beachcomber Dr
- 3101 Vogue Dr
- 3453 Guthrie St
- 3316 Slocum St
- 10816 Cardigan Dr
- 10916 Miller Barber Dr
- 3425 Brookrock St
- 3213 Isla Cocoa Ln
- 10602 Drillstone Dr
- 10817 Ivanhoe Dr Unit 10819
- 10817 Ivanhoe Dr
- 10819 Ivanhoe Dr
- 10821 Ivanhoe Dr Unit 10823
- 10813 Ivanhoe Dr Unit 10815
- 10823 Ivanhoe Dr
- 3152 Hector Dr
- 3152 Hector Dr Unit 1
- 3148 Hector Dr
- 3144 Hector Dr
- 3156 Hector Dr
- 10818 Ivanhoe Dr Unit A
- 10818 Ivanhoe Dr Unit B
- 10825 Ivanhoe Dr
- 10825 Ivanhoe Dr Unit D
- 10822 Ivanhoe Dr Unit AD
- 10822 Ivanhoe Dr
- 10822 Ivanhoe Dr
- 10809 Ivanhoe Dr
- 10809 Ivanhoe Dr Unit 2