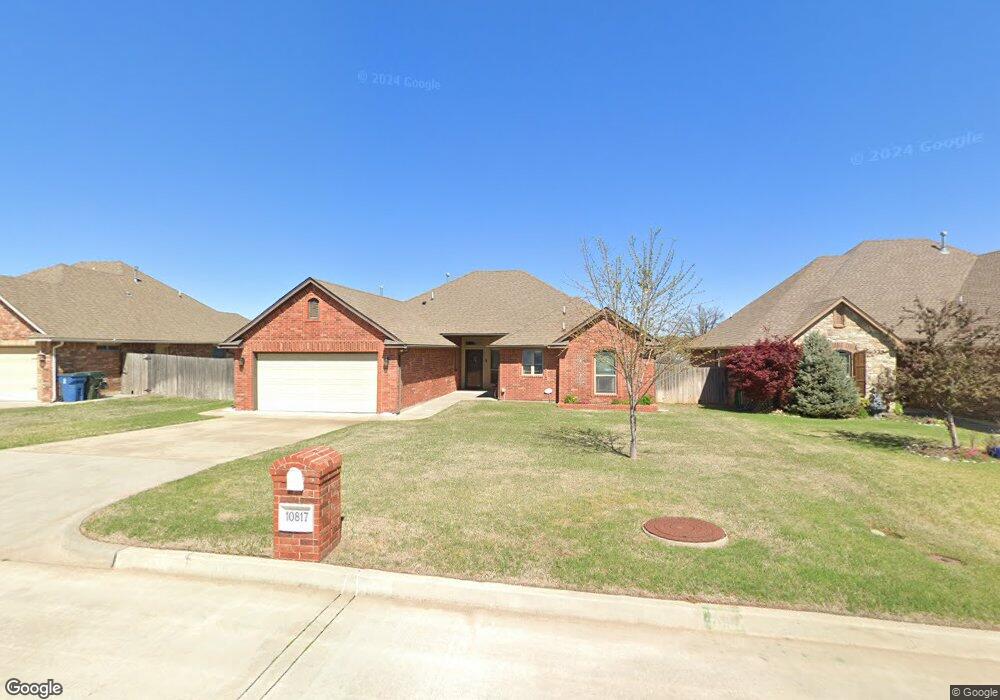
10817 Sara Ct Oklahoma City, OK 73130
Estimated Value: $312,000 - $331,000
--
Bed
--
Bath
1,907
Sq Ft
$168/Sq Ft
Est. Value
About This Home
This home is located at 10817 Sara Ct, Oklahoma City, OK 73130 and is currently estimated at $319,530, approximately $167 per square foot. 10817 Sara Ct is a home with nearby schools including Nicoma Park Elementary School, Nicoma Park Intermediate Elementary School, and Nicoma Park Middle School.
Ownership History
Date
Name
Owned For
Owner Type
Purchase Details
Closed on
Sep 3, 2024
Sold by
Kusler Sheila D
Bought by
Nida Bobbie A
Current Estimated Value
Home Financials for this Owner
Home Financials are based on the most recent Mortgage that was taken out on this home.
Original Mortgage
$174,867
Outstanding Balance
$173,014
Interest Rate
6.78%
Mortgage Type
New Conventional
Estimated Equity
$146,516
Purchase Details
Closed on
Sep 27, 2013
Sold by
Jim Campbell Homes Inc
Bought by
Kusler Sheila D
Home Financials for this Owner
Home Financials are based on the most recent Mortgage that was taken out on this home.
Original Mortgage
$189,905
Interest Rate
4.62%
Mortgage Type
New Conventional
Purchase Details
Closed on
Oct 23, 2012
Sold by
Moore Real Estate Development Inc
Bought by
Jim Campbell Homes Inc
Create a Home Valuation Report for This Property
The Home Valuation Report is an in-depth analysis detailing your home's value as well as a comparison with similar homes in the area
Home Values in the Area
Average Home Value in this Area
Purchase History
| Date | Buyer | Sale Price | Title Company |
|---|---|---|---|
| Nida Bobbie A | $305,000 | Chicago Title | |
| Kusler Sheila D | $200,000 | Stewart Abstract & Title Of | |
| Jim Campbell Homes Inc | $32,000 | -- |
Source: Public Records
Mortgage History
| Date | Status | Borrower | Loan Amount |
|---|---|---|---|
| Open | Nida Bobbie A | $174,867 | |
| Previous Owner | Kusler Sheila D | $189,905 |
Source: Public Records
Tax History Compared to Growth
Tax History
| Year | Tax Paid | Tax Assessment Tax Assessment Total Assessment is a certain percentage of the fair market value that is determined by local assessors to be the total taxable value of land and additions on the property. | Land | Improvement |
|---|---|---|---|---|
| 2024 | $3,130 | $26,122 | $3,982 | $22,140 |
| 2023 | $3,130 | $25,361 | $4,032 | $21,329 |
| 2022 | $3,005 | $24,623 | $4,527 | $20,096 |
| 2021 | $2,902 | $23,906 | $4,662 | $19,244 |
| 2020 | $2,836 | $23,210 | $4,544 | $18,666 |
| 2019 | $2,874 | $23,760 | $4,544 | $19,216 |
| 2018 | $2,671 | $23,320 | $0 | $0 |
| 2017 | $2,642 | $23,099 | $4,411 | $18,688 |
| 2016 | $2,599 | $22,549 | $4,411 | $18,138 |
| 2015 | $2,614 | $21,924 | $4,176 | $17,748 |
| 2014 | $2,608 | $21,779 | $3,901 | $17,878 |
Source: Public Records
Map
Nearby Homes
- 628 N Timber Rd
- 10829 Taylor Paige Dr
- 10910 Garrett Cole Dr
- 912 Klare Ln
- 10915 Blue Sky Dr
- 203 N Westminster Rd
- 528 N White Oak Ave
- 15482 NE 11th St
- Brooklyn Plus Elite 3-car Plan at Choctaw Pointe
- Amelia Elite 3-car Plan at Choctaw Pointe
- Taylor Elite 3-car Plan at Choctaw Pointe
- Ava Elite 3-car Plan at Choctaw Pointe
- Berkeley Elite 3-car Plan at Choctaw Pointe
- Taylor Elite Plan at Choctaw Pointe
- Brooke Elite Plan at Choctaw Pointe
- Tiffany Elite 3-car Plan at Choctaw Pointe
- Newport Elite 3-car Plan at Choctaw Pointe
- Chelsea Elite 3-car Plan at Choctaw Pointe
- 844 N Pine Ave
- 15422 NE 11th St