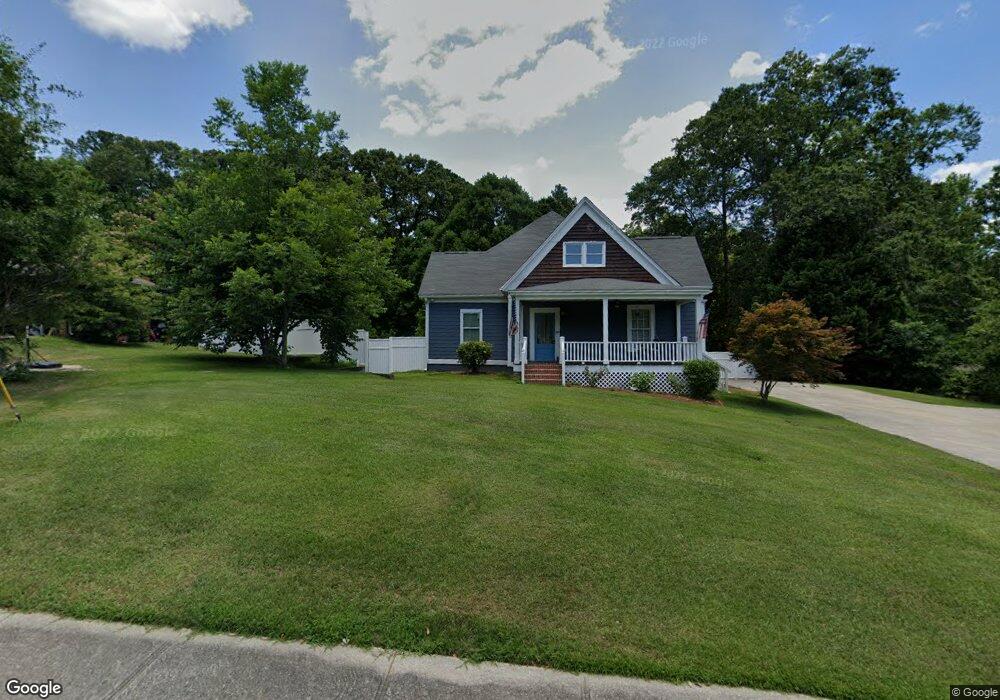
1082 Pine St NE Conyers, GA 30012
Estimated Value: $263,000 - $313,000
4
Beds
3
Baths
3,022
Sq Ft
$92/Sq Ft
Est. Value
About This Home
This home is located at 1082 Pine St NE, Conyers, GA 30012 and is currently estimated at $276,725, approximately $91 per square foot. 1082 Pine St NE is a home located in Rockdale County with nearby schools including Pine Street Elementary School, Conyers Middle School, and Rockdale County High School.
Ownership History
Date
Name
Owned For
Owner Type
Purchase Details
Closed on
Feb 28, 2020
Sold by
Angel Oak Real Estate Investment Trust
Bought by
Phillips Roarke A
Current Estimated Value
Purchase Details
Closed on
Oct 1, 2019
Sold by
Mc War Ecu Llc
Bought by
Angel Oak Real Estate Investment Tr I
Purchase Details
Closed on
Jun 29, 2018
Sold by
Keycorp Financial Inc
Bought by
Ornellas Joseph O and Mcwarecu Llc
Purchase Details
Closed on
Apr 3, 2018
Sold by
M C W A R E C U Llc
Bought by
Keycorp Financial Inc
Purchase Details
Closed on
Oct 4, 2016
Sold by
Ornellas Joseph O
Bought by
Mcwarecu Llc
Home Financials for this Owner
Home Financials are based on the most recent Mortgage that was taken out on this home.
Original Mortgage
$113,750
Interest Rate
3.44%
Purchase Details
Closed on
Jun 24, 2011
Sold by
Adams Robert T
Bought by
Ornellas Joseph O
Home Financials for this Owner
Home Financials are based on the most recent Mortgage that was taken out on this home.
Original Mortgage
$50,040
Interest Rate
4.63%
Create a Home Valuation Report for This Property
The Home Valuation Report is an in-depth analysis detailing your home's value as well as a comparison with similar homes in the area
Home Values in the Area
Average Home Value in this Area
Purchase History
| Date | Buyer | Sale Price | Title Company |
|---|---|---|---|
| Phillips Roarke A | $90,000 | -- | |
| Angel Oak Real Estate Investment Tr I | $110,000 | -- | |
| Ornellas Joseph O | $65,050 | -- | |
| Keycorp Financial Inc | $54,000 | -- | |
| Mcwarecu Llc | $62,500 | -- | |
| Ornellas Joseph O | $62,550 | -- |
Source: Public Records
Mortgage History
| Date | Status | Borrower | Loan Amount |
|---|---|---|---|
| Previous Owner | Mcwarecu Llc | $113,750 | |
| Previous Owner | Ornellas Joseph O | $50,040 |
Source: Public Records
Tax History Compared to Growth
Tax History
| Year | Tax Paid | Tax Assessment Tax Assessment Total Assessment is a certain percentage of the fair market value that is determined by local assessors to be the total taxable value of land and additions on the property. | Land | Improvement |
|---|---|---|---|---|
| 2024 | $4,434 | $77,080 | $13,920 | $63,160 |
| 2023 | $2,807 | $76,880 | $13,920 | $62,960 |
| 2022 | $1,451 | $71,520 | $13,920 | $57,600 |
| 2021 | $1,974 | $53,440 | $7,480 | $45,960 |
| 2020 | $1,055 | $12,040 | $7,480 | $4,560 |
| 2019 | $1,085 | $12,040 | $7,480 | $4,560 |
| 2018 | $361 | $8,000 | $4,800 | $3,200 |
| 2017 | $2,313 | $33,280 | $4,800 | $28,480 |
| 2016 | $2,376 | $34,080 | $4,360 | $29,720 |
| 2015 | $502 | $32,280 | $3,960 | $28,320 |
| 2014 | $457 | $32,480 | $4,160 | $28,320 |
| 2013 | -- | $25,020 | $4,616 | $20,403 |
Source: Public Records
Map
Nearby Homes
- 1031 Pine St NE
- 214 Seward St Unit 94
- 990 Oakland Ave SE
- 1098 Eastview Cir NE
- 1065 Milstead Ave NE
- 1271 Eastview Rd NE
- 1080 Eastview Rd NE
- 1269 Lark Ln NE
- 948 Peek St NW
- 1128 Milstead Ave NE
- 902 Andrews Dr NW
- 1071 Oakland Ave SE Unit D
- 1110 Oakland Ave SE
- 998 Highland Cir SE
- 893 Andrews Dr NW
- 1001 Woodbridge Way NE
- 954 Bryant St SW
- 1007 Peek St NW
- 1076 Pine St NE
- 1085 Pine St NE
- 1092 Pine St NE
- 1071 Pine St NE
- 1102 Pine St NE
- 1095 Pine St NE
- 1064 Pine St NE
- 1061 Pine St NE
- 1057 Pine St NE
- 1052 Pine St NE
- 3322 Conyers Trail
- 1045 Pine St NE
- 0 Conyers Trail
- 1040 Pine St NE
- 1039 Pine St NE
- 1034 Pine St NE
- 819 S Pine St NE
- 824 Greenhill Dr NE
- 0 Pine St NE Unit 8270525
- 0 Pine St NE Unit 8196780