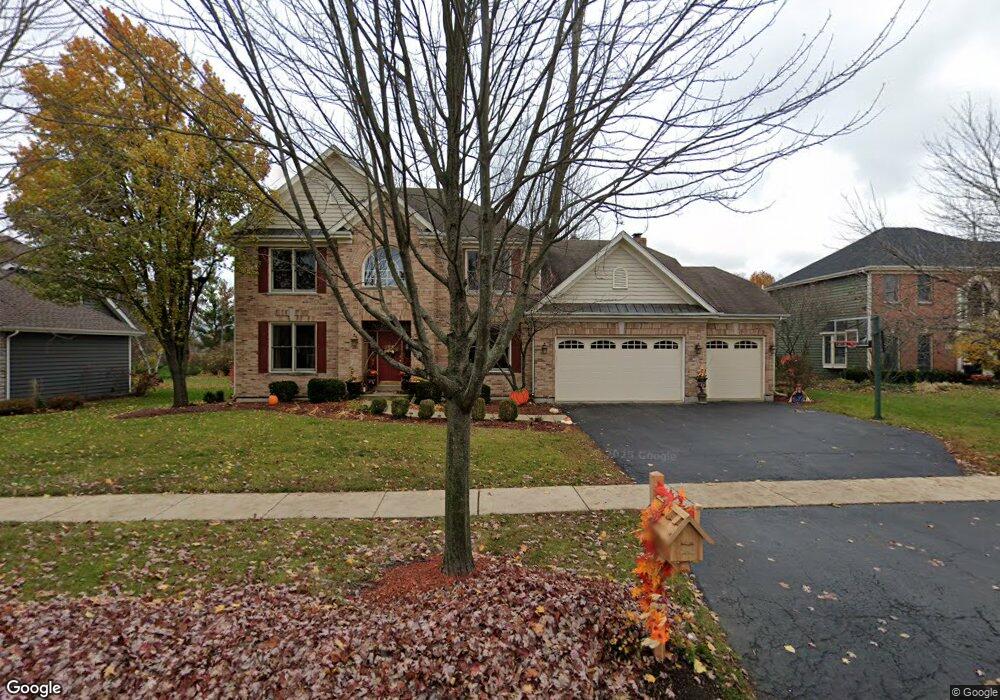
1082 Saint Andrews Cir Geneva, IL 60134
Eagle Brook NeighborhoodEstimated Value: $742,000 - $780,000
5
Beds
3
Baths
2,931
Sq Ft
$259/Sq Ft
Est. Value
About This Home
This home is located at 1082 Saint Andrews Cir, Geneva, IL 60134 and is currently estimated at $759,053, approximately $258 per square foot. 1082 Saint Andrews Cir is a home located in Kane County with nearby schools including Western Avenue Elementary School, Geneva Community High School, and St. Peter School.
Ownership History
Date
Name
Owned For
Owner Type
Purchase Details
Closed on
Nov 16, 2007
Sold by
Bonk Kenneth L and Bonk Kristine J
Bought by
Ammon Peter E and Ammon Cherie S
Current Estimated Value
Home Financials for this Owner
Home Financials are based on the most recent Mortgage that was taken out on this home.
Original Mortgage
$28,500
Outstanding Balance
$5,123
Interest Rate
6.45%
Mortgage Type
Purchase Money Mortgage
Estimated Equity
$753,930
Purchase Details
Closed on
Aug 1, 1996
Sold by
Keim Corp
Bought by
Bonk Kenneth L and Bonk Kristine J
Home Financials for this Owner
Home Financials are based on the most recent Mortgage that was taken out on this home.
Original Mortgage
$190,000
Interest Rate
7.87%
Purchase Details
Closed on
Oct 4, 1995
Sold by
Nbd Bank
Bought by
Keim Corp
Create a Home Valuation Report for This Property
The Home Valuation Report is an in-depth analysis detailing your home's value as well as a comparison with similar homes in the area
Home Values in the Area
Average Home Value in this Area
Purchase History
| Date | Buyer | Sale Price | Title Company |
|---|---|---|---|
| Ammon Peter E | $495,000 | Chicago Title Insurance Co | |
| Bonk Kenneth L | $320,500 | Chicago Title Insurance Co | |
| Keim Corp | $64,000 | Chicago Title Insurance Co |
Source: Public Records
Mortgage History
| Date | Status | Borrower | Loan Amount |
|---|---|---|---|
| Open | Ammon Peter E | $28,500 | |
| Previous Owner | Bonk Kenneth L | $190,000 |
Source: Public Records
Tax History Compared to Growth
Tax History
| Year | Tax Paid | Tax Assessment Tax Assessment Total Assessment is a certain percentage of the fair market value that is determined by local assessors to be the total taxable value of land and additions on the property. | Land | Improvement |
|---|---|---|---|---|
| 2024 | $15,058 | $203,544 | $57,367 | $146,177 |
| 2023 | $14,614 | $185,040 | $52,152 | $132,888 |
| 2022 | $13,945 | $171,938 | $48,459 | $123,479 |
| 2021 | $13,545 | $165,548 | $46,658 | $118,890 |
| 2020 | $13,394 | $163,021 | $45,946 | $117,075 |
| 2019 | $13,362 | $159,934 | $45,076 | $114,858 |
| 2018 | $12,900 | $154,843 | $45,076 | $109,767 |
| 2017 | $12,760 | $150,714 | $43,874 | $106,840 |
| 2016 | $12,825 | $148,677 | $43,281 | $105,396 |
| 2015 | -- | $141,354 | $41,149 | $100,205 |
| 2014 | -- | $136,211 | $41,149 | $95,062 |
| 2013 | -- | $136,211 | $41,149 | $95,062 |
Source: Public Records
Map
Nearby Homes
- 2147 Fargo Blvd
- 839 S Randall Rd
- 1417 Sherwood Ln
- 1580 Turnberry Ct
- 2694 Berkshire Dr Unit 8
- 1736 Kaneville Rd
- 106 Bridgeport Ln
- 1437 Cooper Ln
- 2927 Caldwell Ln Unit 2
- 2671 Stone Cir Unit 208
- 1530 Kaneville Rd
- 51 Burgess Rd
- 2692 Stone Cir Unit 203
- 2769 Stone Cir
- 2749 Stone Cir
- 2771 Stone Cir
- 2753 Stone Cir
- 2767 Stone Cir
- 2747 Stone Cir
- 2751 Stone Cir
- 1074 Saint Andrews Cir
- 1090 Saint Andrews Cir
- 2232 Fargo Blvd
- 903 Saint Andrews Cir
- 2192 Fargo Blvd
- 2254 Fargo Blvd
- 1058 Saint Andrews Cir
- 904 Saint Andrews Cir
- 2231 Fargo Blvd
- 2178 Fargo Blvd
- 2209 Fargo Blvd
- 2253 Fargo Blvd
- 907 Saint Andrews Cir
- 2197 Fargo Blvd
- 1050 Saint Andrews Cir
- 1063 Saint Andrews Cir
- 2275 Fargo Blvd
- 2154 Fargo Blvd
- 920 Saint Andrews Cir
- 2185 Fargo Blvd