10820 Curth Rd Jonesville, MI 49250
Estimated Value: $181,591 - $424,000
2
Beds
2
Baths
2,264
Sq Ft
$117/Sq Ft
Est. Value
About This Home
This home is located at 10820 Curth Rd, Jonesville, MI 49250 and is currently estimated at $265,648, approximately $117 per square foot. 10820 Curth Rd is a home located in Hillsdale County with nearby schools including Williams Elementary School, Jonesville Middle School, and Jonesville High School.
Ownership History
Date
Name
Owned For
Owner Type
Purchase Details
Closed on
Sep 10, 2009
Sold by
Vance Judith K
Bought by
Stella Andrew J
Current Estimated Value
Home Financials for this Owner
Home Financials are based on the most recent Mortgage that was taken out on this home.
Original Mortgage
$100,000
Outstanding Balance
$65,830
Interest Rate
5.32%
Mortgage Type
New Conventional
Estimated Equity
$199,818
Purchase Details
Closed on
Sep 9, 2000
Sold by
Hammond Mary K
Bought by
Vance, Judith K Trust
Purchase Details
Closed on
May 11, 1999
Sold by
Hammond Mary K
Bought by
Hammond, Mary K Trust
Purchase Details
Closed on
Nov 29, 1993
Sold by
Gunter Dan A and Wood Shelly Gunter
Bought by
Vance Judith Kay and Hammond Mary K
Purchase Details
Closed on
Nov 25, 1993
Sold by
Lemmon Mary Ellen
Bought by
Gunter Dan A
Purchase Details
Closed on
Sep 30, 1988
Sold by
Lemmon Mary Ellen
Bought by
Gunter Dan A
Create a Home Valuation Report for This Property
The Home Valuation Report is an in-depth analysis detailing your home's value as well as a comparison with similar homes in the area
Home Values in the Area
Average Home Value in this Area
Purchase History
| Date | Buyer | Sale Price | Title Company |
|---|---|---|---|
| Stella Andrew J | $125,000 | Public Title Agency | |
| Vance, Judith K Trust | -- | -- | |
| Hammond, Mary K Trust | -- | -- | |
| Vance Judith Kay | $53,900 | -- | |
| Gunter Dan A | $43,900 | -- | |
| Gunter Dan A | $43,900 | -- |
Source: Public Records
Mortgage History
| Date | Status | Borrower | Loan Amount |
|---|---|---|---|
| Open | Stella Andrew J | $100,000 |
Source: Public Records
Tax History Compared to Growth
Tax History
| Year | Tax Paid | Tax Assessment Tax Assessment Total Assessment is a certain percentage of the fair market value that is determined by local assessors to be the total taxable value of land and additions on the property. | Land | Improvement |
|---|---|---|---|---|
| 2025 | $1,102 | $77,100 | $0 | $0 |
| 2024 | $401 | $73,400 | $0 | $0 |
| 2023 | $382 | $66,700 | $0 | $0 |
| 2022 | $939 | $57,300 | $0 | $0 |
| 2021 | $911 | $49,700 | $0 | $0 |
| 2020 | $903 | $44,800 | $0 | $0 |
| 2019 | $936 | $40,700 | $0 | $0 |
| 2018 | $897 | $37,820 | $0 | $0 |
| 2017 | $799 | $38,410 | $0 | $0 |
| 2016 | $792 | $35,200 | $0 | $0 |
| 2015 | $322 | $35,200 | $0 | $0 |
| 2013 | $312 | $28,470 | $0 | $0 |
| 2012 | $358 | $33,790 | $0 | $0 |
Source: Public Records
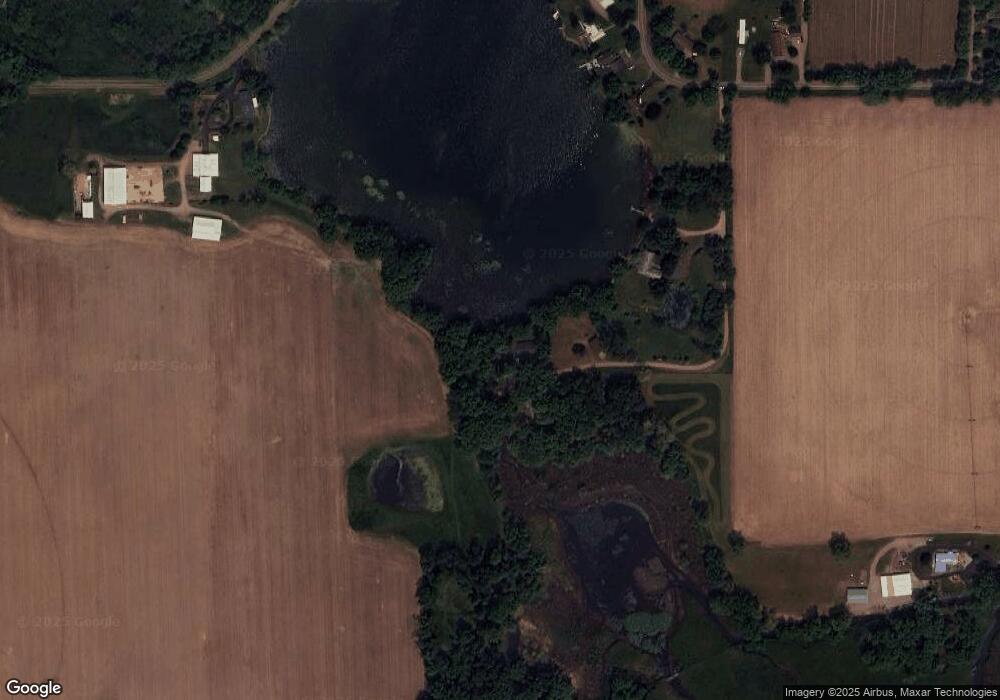
Map
Nearby Homes
- 11263 Winfield Rd
- 2752 W Mosherville Rd
- 11416 Concord Rd
- VL Rowe Rd
- 11500 Goose Lake Rd
- 3714 W Hastings Lake Rd
- 11441 Wooden Rd
- 1477 E Hastings Lake Rd
- 11980 Hanover Rd
- 11091 Milnes Rd
- 10180 Milnes Rd
- 10750 Pulaski Rd
- 10420 E Mosherville Rd
- 9475 Homer Rd
- 0 Grover Rd Unit 25049399
- 400 Parkwood Dr
- 463 E Chicago St
- 409 Evans St
- 11965 Strait Rd
- 321 North St
- 10844 Curth Rd
- 10842 Curth Rd
- 10900 Curth Rd
- 1359 W Mosherville Rd
- 1369 W Mosherville Rd
- 1379 W Mosherville Rd
- 1431 W Mosherville Rd
- 1411 Mosherville
- 1411 W Mosherville Rd
- 1451 W Mosherville Rd
- 1640 W Mosherville Rd
- 1460 W Mosherville Rd
- 1540 W Mosherville Rd
- 1460 W Mosherville Rd
- 1600 W Mosherville Rd
- 10800 Concord Rd
- 1500 W Mosherville Rd
- 1400 W Mosherville Rd
- 11250 Winfield Rd
- 1989 Plain St