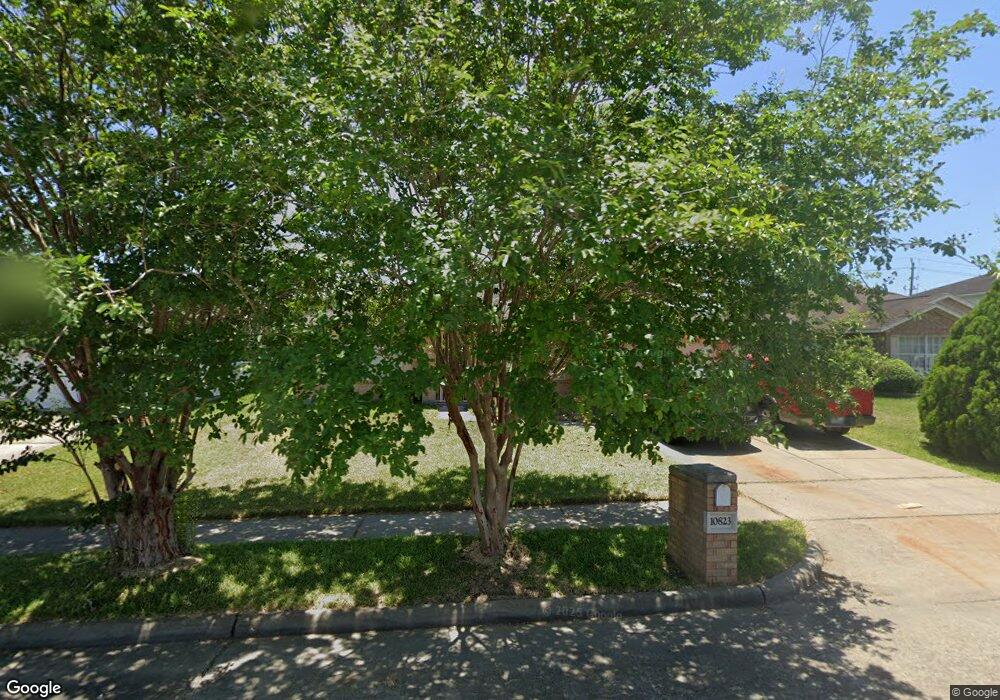
10823 Malden Dr Houston, TX 77075
Southbelt-Ellington NeighborhoodEstimated Value: $276,690 - $297,000
3
Beds
2
Baths
2,161
Sq Ft
$133/Sq Ft
Est. Value
About This Home
This home is located at 10823 Malden Dr, Houston, TX 77075 and is currently estimated at $286,423, approximately $132 per square foot. 10823 Malden Dr is a home located in Harris County with nearby schools including Atkinson Elementary School, Morris Middle School, and Beverly Hill Intermediate School.
Ownership History
Date
Name
Owned For
Owner Type
Purchase Details
Closed on
Apr 13, 2004
Sold by
Orozco Sandra and Orozco Brenda
Bought by
Orozco Honorio
Current Estimated Value
Home Financials for this Owner
Home Financials are based on the most recent Mortgage that was taken out on this home.
Original Mortgage
$72,900
Outstanding Balance
$34,186
Interest Rate
5.61%
Mortgage Type
New Conventional
Estimated Equity
$252,237
Purchase Details
Closed on
Apr 24, 1998
Sold by
Chatwood Place Inc
Bought by
Orozco Sandra and Orozco Brenda
Home Financials for this Owner
Home Financials are based on the most recent Mortgage that was taken out on this home.
Original Mortgage
$81,705
Interest Rate
7.09%
Mortgage Type
FHA
Purchase Details
Closed on
Jan 14, 1998
Sold by
Parkstone Building Company
Bought by
Chatwood Place Inc
Create a Home Valuation Report for This Property
The Home Valuation Report is an in-depth analysis detailing your home's value as well as a comparison with similar homes in the area
Home Values in the Area
Average Home Value in this Area
Purchase History
| Date | Buyer | Sale Price | Title Company |
|---|---|---|---|
| Orozco Honorio | -- | Alamo Title | |
| Orozco Sandra | -- | Commonwealth Land Title Co | |
| Chatwood Place Inc | -- | Commonwealth Land Title Co |
Source: Public Records
Mortgage History
| Date | Status | Borrower | Loan Amount |
|---|---|---|---|
| Open | Orozco Honorio | $72,900 | |
| Closed | Orozco Sandra | $81,705 | |
| Closed | Orozco Sandra | $9,500 | |
| Closed | Orozco Honorio | $5,000 |
Source: Public Records
Tax History Compared to Growth
Tax History
| Year | Tax Paid | Tax Assessment Tax Assessment Total Assessment is a certain percentage of the fair market value that is determined by local assessors to be the total taxable value of land and additions on the property. | Land | Improvement |
|---|---|---|---|---|
| 2025 | $4,472 | $288,051 | $53,664 | $234,387 |
| 2024 | $4,472 | $272,247 | $53,664 | $218,583 |
| 2023 | $4,472 | $297,001 | $53,664 | $243,337 |
| 2022 | $5,600 | $247,939 | $41,184 | $206,755 |
| 2021 | $5,342 | $198,873 | $41,184 | $157,689 |
| 2020 | $5,247 | $191,396 | $37,440 | $153,956 |
| 2019 | $5,202 | $186,899 | $34,320 | $152,579 |
| 2018 | $1,891 | $164,038 | $26,520 | $137,518 |
| 2017 | $4,518 | $164,038 | $26,520 | $137,518 |
| 2016 | $4,221 | $153,270 | $24,024 | $129,246 |
| 2015 | $2,944 | $143,669 | $21,840 | $121,829 |
| 2014 | $2,944 | $132,653 | $21,840 | $110,813 |
Source: Public Records
Map
Nearby Homes
- 10831 Cayman Mist Dr
- 10827 Linden Gate Dr
- 9423 Garden Bridge St
- 10918 Linden Gate Dr
- 7329 Madison Commons Ln
- 7322 Madison Commons Ln
- 9319 Canady Park Ln
- 11019 Cayman Mist Dr
- 0 Fuqua St Unit 64883593
- 0 Fuqua St Unit 45902141
- 0 Fuqua St Unit 97219329
- 10518 Tenleyton Ln
- 10858 Shannon Mills Ln
- 10506 Pleasant Villas Ln
- 10906 Stover St
- 10847 Nellsfield Ln
- 9411 Kingsvalley St
- 9303 Kingsflower Cir
- 10610 Stover St
- 10406 Sutter Glen Ln
- 10827 Malden Dr
- 10819 Malden Dr
- 9618 Blackhawk Blvd
- 9622 Blackhawk Blvd
- 10815 Malden Dr
- 10831 Malden Dr
- 9614 Blackhawk Blvd
- 9626 Blackhawk Blvd
- 10822 Malden Dr
- 10818 Malden Dr
- 10826 Malden Dr
- 10811 Malden Dr
- 9610 Blackhawk Blvd
- 10814 Malden Dr
- 9630 Blackhawk Blvd
- 10835 Malden Dr
- 10830 Malden Dr
- 10810 Malden Dr
- 9606 Blackhawk Blvd
- 10839 Malden Dr