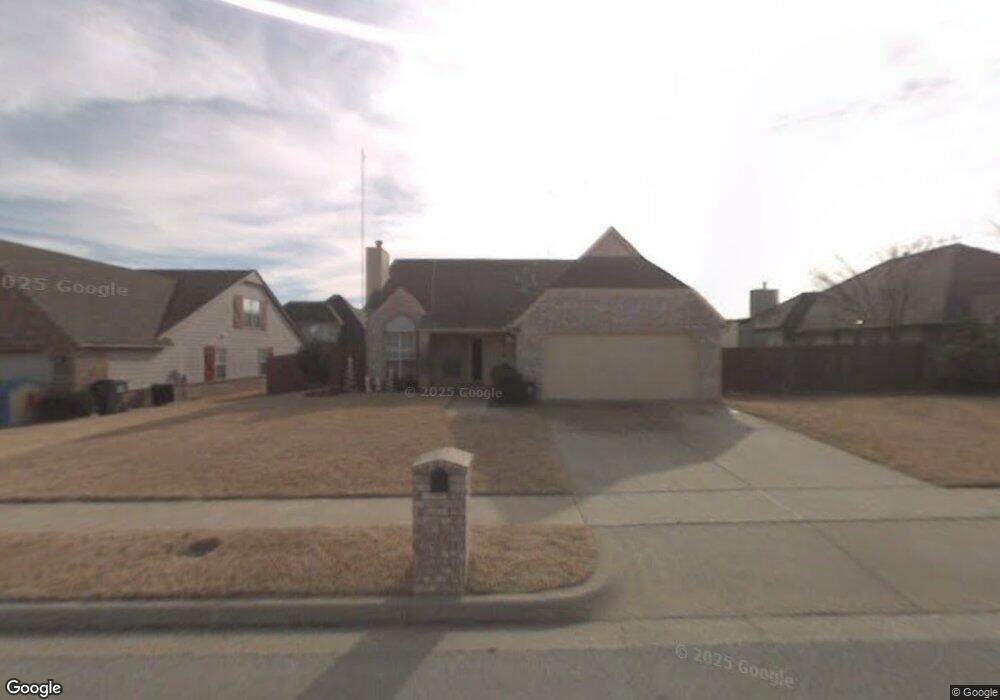
10828 E 115th St S Bixby, OK 74008
North Bixby NeighborhoodEstimated Value: $308,000 - $333,000
4
Beds
2
Baths
2,315
Sq Ft
$138/Sq Ft
Est. Value
About This Home
This home is located at 10828 E 115th St S, Bixby, OK 74008 and is currently estimated at $318,981, approximately $137 per square foot. 10828 E 115th St S is a home located in Tulsa County with nearby schools including Bixby East Elementary, Bixby Middle School, and Bixby High School.
Ownership History
Date
Name
Owned For
Owner Type
Purchase Details
Closed on
May 20, 2008
Sold by
Crall Sean E and Crall Laurie E
Bought by
Crall Sean E and Crall Laurie E
Current Estimated Value
Home Financials for this Owner
Home Financials are based on the most recent Mortgage that was taken out on this home.
Original Mortgage
$173,768
Outstanding Balance
$111,135
Interest Rate
6.07%
Mortgage Type
FHA
Estimated Equity
$207,846
Purchase Details
Closed on
May 16, 2008
Sold by
Hahn Daniel L and Hahn Lori Eleanor
Bought by
Crall Sean E
Home Financials for this Owner
Home Financials are based on the most recent Mortgage that was taken out on this home.
Original Mortgage
$173,768
Outstanding Balance
$111,135
Interest Rate
6.07%
Mortgage Type
FHA
Estimated Equity
$207,846
Purchase Details
Closed on
Apr 23, 2001
Sold by
Hill Ronald W
Bought by
Hahn Daniel L and Hahn Lori Eleanor
Purchase Details
Closed on
Nov 26, 1997
Sold by
Perry Hood Properties Inc
Bought by
Hill Ronald W and Hill Laci D
Create a Home Valuation Report for This Property
The Home Valuation Report is an in-depth analysis detailing your home's value as well as a comparison with similar homes in the area
Home Values in the Area
Average Home Value in this Area
Purchase History
| Date | Buyer | Sale Price | Title Company |
|---|---|---|---|
| Crall Sean E | -- | None Available | |
| Crall Sean E | $176,500 | None Available | |
| Hahn Daniel L | $135,000 | First Amer Title & Abstract | |
| Hill Ronald W | $100,000 | Guaranty Abstract Company |
Source: Public Records
Mortgage History
| Date | Status | Borrower | Loan Amount |
|---|---|---|---|
| Open | Crall Sean E | $173,768 |
Source: Public Records
Tax History Compared to Growth
Tax History
| Year | Tax Paid | Tax Assessment Tax Assessment Total Assessment is a certain percentage of the fair market value that is determined by local assessors to be the total taxable value of land and additions on the property. | Land | Improvement |
|---|---|---|---|---|
| 2024 | $2,977 | $21,945 | $1,854 | $20,091 |
| 2023 | $2,977 | $22,277 | $2,080 | $20,197 |
| 2022 | $2,898 | $20,628 | $2,650 | $17,978 |
| 2021 | $2,626 | $19,998 | $2,569 | $17,429 |
| 2020 | $2,562 | $19,386 | $2,636 | $16,750 |
| 2019 | $2,572 | $19,386 | $2,636 | $16,750 |
| 2018 | $2,548 | $19,386 | $2,636 | $16,750 |
| 2017 | $2,532 | $20,386 | $2,772 | $17,614 |
| 2016 | $2,501 | $20,386 | $2,772 | $17,614 |
| 2015 | $2,515 | $20,386 | $2,772 | $17,614 |
| 2014 | $2,511 | $20,386 | $2,772 | $17,614 |
Source: Public Records
Map
Nearby Homes
- 10607 E 115th St S
- 11318 S 108th East Place
- 11620 S 104th East Ave
- 10306 E 114th Place S
- 11631 S 103rd East Ave
- 12509 S 102nd East Ave
- 15404 S 34th East Ave
- 11612 S 101st East Ave
- 11611 S 100th East Ave
- 13114 S 100th East Ave
- 9905 E 117th Place S
- 9907 E 118th St S
- 9923 E 119th Place S
- 4708 S Sequoia Ave
- 4607 S Retana Place
- 4529 S Retana Ave
- 4618 S Retana Place
- 12202 S 102nd East Ave
- 9521 E 117th St S
- 13506 S 101st Ave E
- 10820 E 115th St S
- 10836 E 115th St S
- 10829 E 115th Place S
- 10821 E 115th Place S
- 10837 E 115th Place S
- 10812 E 115th St S
- 10831 E 115th St S
- 10831 E 115th St S Unit South
- 10823 E 115th St S
- 10804 E 115th St S
- 10815 E 115th St S
- 11507 S 108th East Place
- 11503 S 108th East Place
- 10805 E 115th Place S
- 11515 S 108th East Place
- 11435 S 108th East Place
- 10807 E 115th St S
- 10830 E 114th Place S
- 10826 E 115th Place S