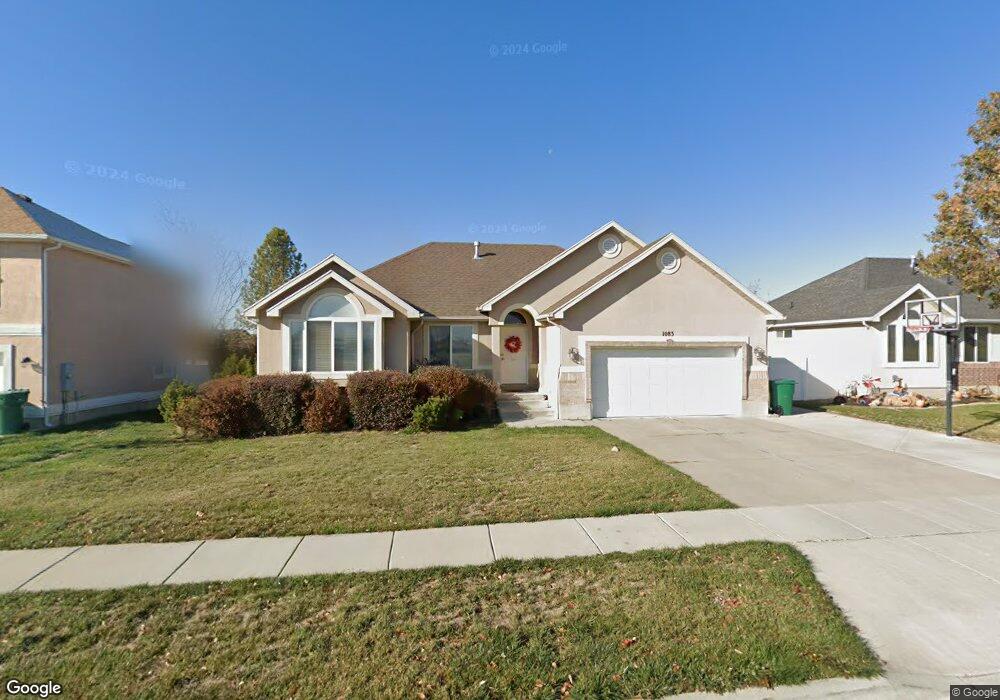
1083 N 2025 W Layton, UT 84041
Estimated Value: $569,000 - $602,000
5
Beds
3
Baths
2,988
Sq Ft
$196/Sq Ft
Est. Value
About This Home
This home is located at 1083 N 2025 W, Layton, UT 84041 and is currently estimated at $586,710, approximately $196 per square foot. 1083 N 2025 W is a home located in Davis County with nearby schools including Ellison Park School, Shoreline Junior High School, and Layton High School.
Ownership History
Date
Name
Owned For
Owner Type
Purchase Details
Closed on
Jan 29, 2014
Sold by
Riney Michael P and Riney Michele
Bought by
Hess Tony J and Hess Leah O
Current Estimated Value
Home Financials for this Owner
Home Financials are based on the most recent Mortgage that was taken out on this home.
Original Mortgage
$199,920
Outstanding Balance
$105,066
Interest Rate
4.45%
Mortgage Type
New Conventional
Estimated Equity
$481,644
Purchase Details
Closed on
Nov 26, 2002
Sold by
Destination Homes Inc
Bought by
Riney Michael P and Riney Michele
Home Financials for this Owner
Home Financials are based on the most recent Mortgage that was taken out on this home.
Original Mortgage
$184,739
Interest Rate
6.12%
Mortgage Type
VA
Purchase Details
Closed on
Aug 12, 2002
Sold by
Discovery Development Llc
Bought by
Destination Homes Inc
Home Financials for this Owner
Home Financials are based on the most recent Mortgage that was taken out on this home.
Original Mortgage
$139,850
Interest Rate
6.51%
Mortgage Type
Construction
Create a Home Valuation Report for This Property
The Home Valuation Report is an in-depth analysis detailing your home's value as well as a comparison with similar homes in the area
Home Values in the Area
Average Home Value in this Area
Purchase History
| Date | Buyer | Sale Price | Title Company |
|---|---|---|---|
| Hess Tony J | -- | Cornerstone Title Inc | |
| Riney Michael P | -- | Bonneville Title Company Inc | |
| Destination Homes Inc | -- | Bonneville Title Company Inc |
Source: Public Records
Mortgage History
| Date | Status | Borrower | Loan Amount |
|---|---|---|---|
| Open | Hess Tony J | $199,920 | |
| Previous Owner | Riney Michael P | $184,739 | |
| Previous Owner | Destination Homes Inc | $139,850 |
Source: Public Records
Tax History Compared to Growth
Tax History
| Year | Tax Paid | Tax Assessment Tax Assessment Total Assessment is a certain percentage of the fair market value that is determined by local assessors to be the total taxable value of land and additions on the property. | Land | Improvement |
|---|---|---|---|---|
| 2025 | $2,830 | $297,000 | $116,692 | $180,308 |
| 2024 | $2,804 | $296,450 | $127,857 | $168,593 |
| 2023 | $2,693 | $502,000 | $128,980 | $373,020 |
| 2022 | $2,793 | $282,700 | $79,000 | $203,700 |
| 2021 | $2,756 | $416,000 | $118,514 | $297,486 |
| 2020 | $2,493 | $361,000 | $100,136 | $260,864 |
| 2019 | $2,383 | $338,000 | $101,792 | $236,208 |
| 2018 | $2,191 | $312,000 | $89,384 | $222,616 |
| 2016 | $1,930 | $141,735 | $35,600 | $106,135 |
| 2015 | $1,924 | $134,200 | $35,600 | $98,600 |
| 2014 | $1,795 | $127,979 | $35,600 | $92,379 |
| 2013 | -- | $138,556 | $34,742 | $103,814 |
Source: Public Records
Map
Nearby Homes
- 2115 W 1225 N
- 979 Cold Creek Way
- 1219 N 1875 W
- 1219 N 1875 W Unit 212
- 1211 N 1875 W Unit 211
- 1211 N 1875 W
- Fremont Plan at Trailside
- Blakely Plan at Trailside
- Arlington Plan at Trailside
- Savannah Plan at Trailside
- Charlotte Plan at Trailside
- Birmingham Plan at Trailside
- Oakridge Plan at Trailside
- Middleton Plan at Trailside
- Wilmington Plan at Trailside
- 916 Cold Creek Way
- 1452 N 1875 W Unit 146
- 2036 W 775 N
- 1451 N 1875 W Unit 168
- 1455 N 1875 W Unit 167