Estimated Value: $730,000 - $861,000
5
Beds
3
Baths
2,588
Sq Ft
$313/Sq Ft
Est. Value
About This Home
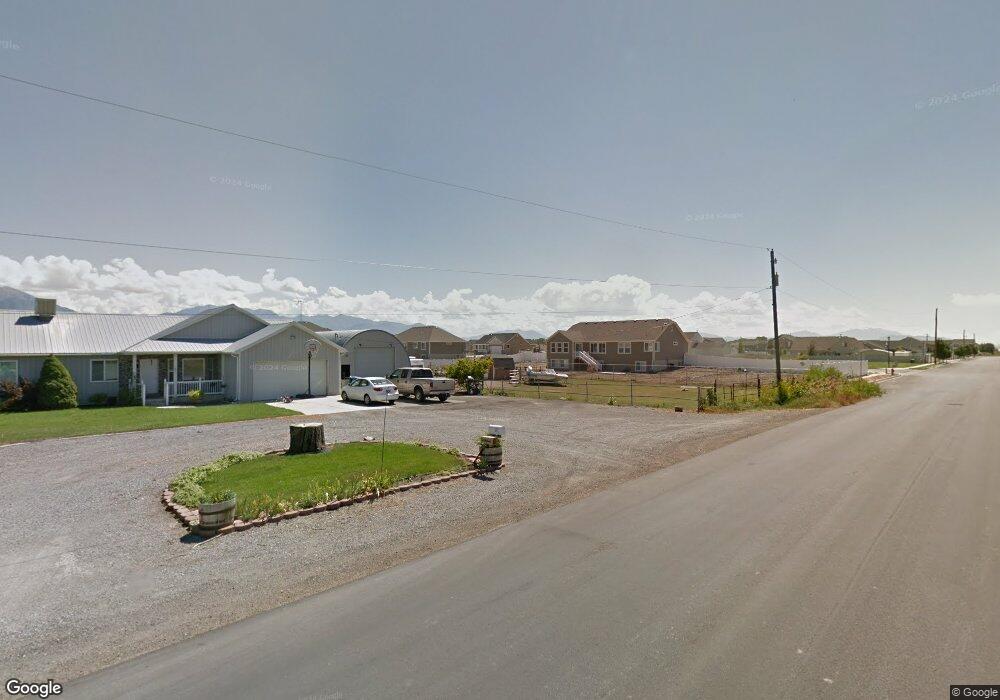
This home is located at 1083 W 1630 S Unit 7, Lehi, UT 84043 and is currently estimated at $811,235, approximately $313 per square foot. 1083 W 1630 S Unit 7 is a home located in Utah County with nearby schools including Dry Creek Elementary School, Willowcreek Middle School, and Lehi High School.
Ownership History
Date
Name
Owned For
Owner Type
Purchase Details
Closed on
Apr 12, 2019
Sold by
Poulsen Dennis and Poulsen Shannon
Bought by
Poulsen Richard B and Poulsen Rachel M
Current Estimated Value
Home Financials for this Owner
Home Financials are based on the most recent Mortgage that was taken out on this home.
Original Mortgage
$438,000
Outstanding Balance
$385,855
Interest Rate
4.4%
Mortgage Type
New Conventional
Estimated Equity
$425,380
Purchase Details
Closed on
Mar 11, 2019
Sold by
Poulsen Dennis and Poulsen Shannon
Bought by
Poulsen Dennis and Poulsen Shannon
Home Financials for this Owner
Home Financials are based on the most recent Mortgage that was taken out on this home.
Original Mortgage
$438,000
Outstanding Balance
$385,855
Interest Rate
4.4%
Mortgage Type
New Conventional
Estimated Equity
$425,380
Purchase Details
Closed on
Jul 21, 2017
Sold by
Journeys End Homes Llc
Bought by
Poulsen Dennis and Poulsen Shannon
Purchase Details
Closed on
May 5, 2017
Sold by
Rhutah Properties Llc
Bought by
Journeys End Homes Llc
Create a Home Valuation Report for This Property
The Home Valuation Report is an in-depth analysis detailing your home's value as well as a comparison with similar homes in the area
Home Values in the Area
Average Home Value in this Area
Purchase History
| Date | Buyer | Sale Price | Title Company |
|---|---|---|---|
| Poulsen Richard B | -- | Title Guarantee | |
| Poulsen Dennis | -- | Title Guarantee | |
| Poulsen Dennis | -- | Utah First Title Ins Agcy | |
| Journeys End Homes Llc | -- | North American Title |
Source: Public Records
Mortgage History
| Date | Status | Borrower | Loan Amount |
|---|---|---|---|
| Open | Poulsen Richard B | $438,000 | |
| Closed | Poulsen Dennis | $433,000 |
Source: Public Records
Tax History Compared to Growth
Tax History
| Year | Tax Paid | Tax Assessment Tax Assessment Total Assessment is a certain percentage of the fair market value that is determined by local assessors to be the total taxable value of land and additions on the property. | Land | Improvement |
|---|---|---|---|---|
| 2025 | $3,267 | $409,585 | $295,400 | $449,300 |
| 2024 | $3,267 | $382,360 | $0 | $0 |
| 2023 | $3,077 | $390,995 | $0 | $0 |
| 2022 | $2,960 | $364,595 | $0 | $0 |
| 2021 | $2,622 | $488,300 | $171,000 | $317,300 |
| 2020 | $2,471 | $454,800 | $158,300 | $296,500 |
| 2019 | $2,233 | $427,400 | $158,300 | $269,100 |
| 2018 | $1,552 | $154,400 | $154,400 | $0 |
| 2017 | $1,405 | $135,100 | $0 | $0 |
| 2016 | $1,470 | $131,200 | $0 | $0 |
Source: Public Records
Map
Nearby Homes
- 218 N Husker Ln
- 242 N Husker Ln Unit 8
- 178 N Husker Ln Unit 2
- Willow Plan at Freedom View Cove
- Oak Plan at Freedom View Cove
- 181 N Husker Ln Unit 14
- 72 N Montrose Ln
- 77 N Richmond Ln
- 2256 E Loch Lomond Dr
- Willow Plan at North Lake Meadows
- Juniper Plan at North Lake Meadows
- Longleaf Plan at North Lake Meadows
- Maple Plan at North Lake Meadows
- Oak Plan at North Lake Meadows
- Cypress Plan at North Lake Meadows
- 671 W 975 S
- 1967 E 145 N
- 817 S 1365 W
- 1812 N Lake Rd
- 1526 E Livi Ln Unit 9
- 7532 N 8730 W
- 1061 W 1630 S Unit 6
- 1086 W 1630 S Unit 1
- 1064 W 1630 S
- 1076 W 1700 S
- 1076 W 1700 S Unit 1
- 1076 W 1700 S Unit 1
- 1039 W 1630 S Unit 1
- 1023 W 1630 S Unit 4
- 1023 W 1630 S
- 1042 W 1630 S Unit 1
- 1042 W 1630 S Unit 3
- 2038 E Brenners St
- 1032 W 1700 S
- 1032 W 1700 S Unit 2
- 1032 W 1700 S Unit 2
- 7360 N 8730 W
- 7542 N 8730 W
- 2028 E Brenners St Unit 102
- 1636 S 980 W Unit 4