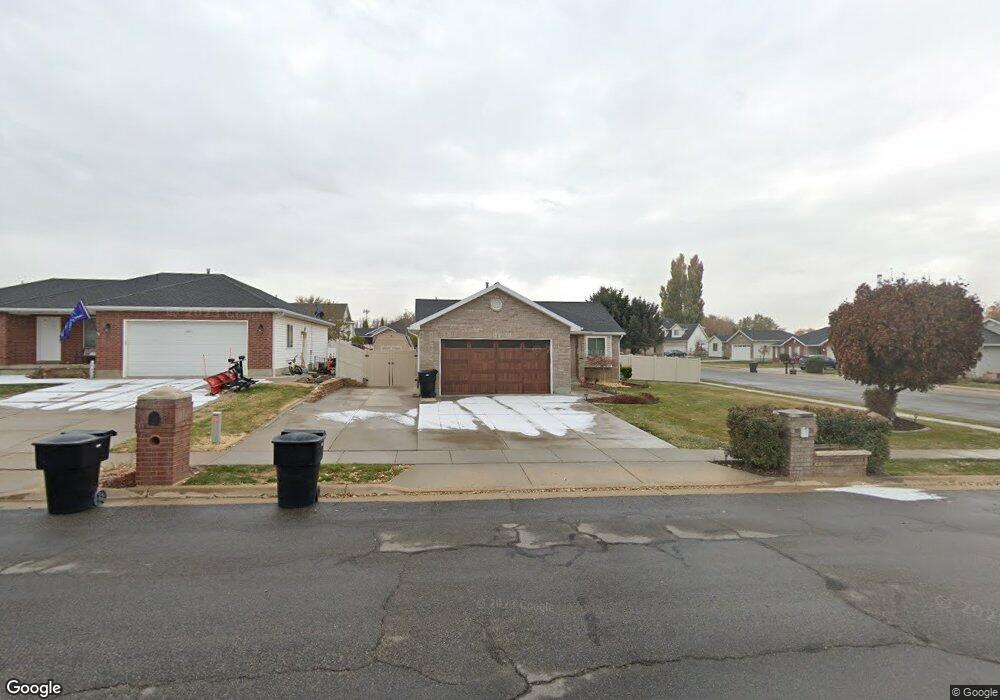
1083 W 1950 N Clearfield, UT 84015
Estimated Value: $427,000 - $463,963
4
Beds
2
Baths
2,136
Sq Ft
$211/Sq Ft
Est. Value
About This Home
This home is located at 1083 W 1950 N, Clearfield, UT 84015 and is currently estimated at $451,241, approximately $211 per square foot. 1083 W 1950 N is a home located in Davis County with nearby schools including Clinton Elementary School, Sunset Junior High School, and Clearfield High School.
Ownership History
Date
Name
Owned For
Owner Type
Purchase Details
Closed on
Dec 13, 2021
Sold by
Clements Brian K and Clements Donelle M
Bought by
Clements Brian K and Clements Donelle M
Current Estimated Value
Purchase Details
Closed on
Apr 27, 2001
Sold by
Selander Susan L and Johnson Susan Lynette
Bought by
Clements Brian K and Clements Donelle M
Purchase Details
Closed on
Oct 1, 1998
Sold by
Ken Mitchell Development Co Inc
Bought by
Johnson Susan Lynette
Home Financials for this Owner
Home Financials are based on the most recent Mortgage that was taken out on this home.
Original Mortgage
$115,031
Interest Rate
6.88%
Mortgage Type
FHA
Purchase Details
Closed on
Apr 29, 1998
Sold by
Kecher Development Llc
Bought by
Ken Mitchell Development Co Inc and Mitchell Kenneth J
Home Financials for this Owner
Home Financials are based on the most recent Mortgage that was taken out on this home.
Original Mortgage
$100,000
Interest Rate
7.06%
Create a Home Valuation Report for This Property
The Home Valuation Report is an in-depth analysis detailing your home's value as well as a comparison with similar homes in the area
Home Values in the Area
Average Home Value in this Area
Purchase History
| Date | Buyer | Sale Price | Title Company |
|---|---|---|---|
| Clements Brian K | -- | None Available | |
| Clements Brian K | -- | Us Title | |
| Johnson Susan Lynette | -- | Founders Title Company | |
| Ken Mitchell Development Co Inc | -- | Founders Title Co |
Source: Public Records
Mortgage History
| Date | Status | Borrower | Loan Amount |
|---|---|---|---|
| Previous Owner | Johnson Susan Lynette | $115,031 | |
| Previous Owner | Ken Mitchell Development Co Inc | $100,000 |
Source: Public Records
Tax History Compared to Growth
Tax History
| Year | Tax Paid | Tax Assessment Tax Assessment Total Assessment is a certain percentage of the fair market value that is determined by local assessors to be the total taxable value of land and additions on the property. | Land | Improvement |
|---|---|---|---|---|
| 2025 | -- | $234,850 | $85,976 | $148,874 |
| 2024 | -- | $227,150 | $94,491 | $132,659 |
| 2023 | $1,022 | $417,000 | $107,532 | $309,468 |
| 2022 | $1,022 | $243,100 | $65,749 | $177,351 |
| 2021 | $500 | $324,000 | $82,358 | $241,642 |
| 2020 | $206 | $277,000 | $70,005 | $206,995 |
| 2019 | $166 | $266,000 | $81,761 | $184,239 |
| 2018 | $0 | $220,000 | $69,052 | $150,948 |
| 2016 | $1,433 | $103,125 | $26,894 | $76,231 |
| 2015 | $1,435 | $98,230 | $26,894 | $71,336 |
| 2014 | $642 | $94,250 | $26,894 | $67,356 |
| 2013 | -- | $103,179 | $27,143 | $76,036 |
Source: Public Records
Map
Nearby Homes