Estimated Value: $220,183 - $269,000
3
Beds
1
Bath
1,513
Sq Ft
$162/Sq Ft
Est. Value
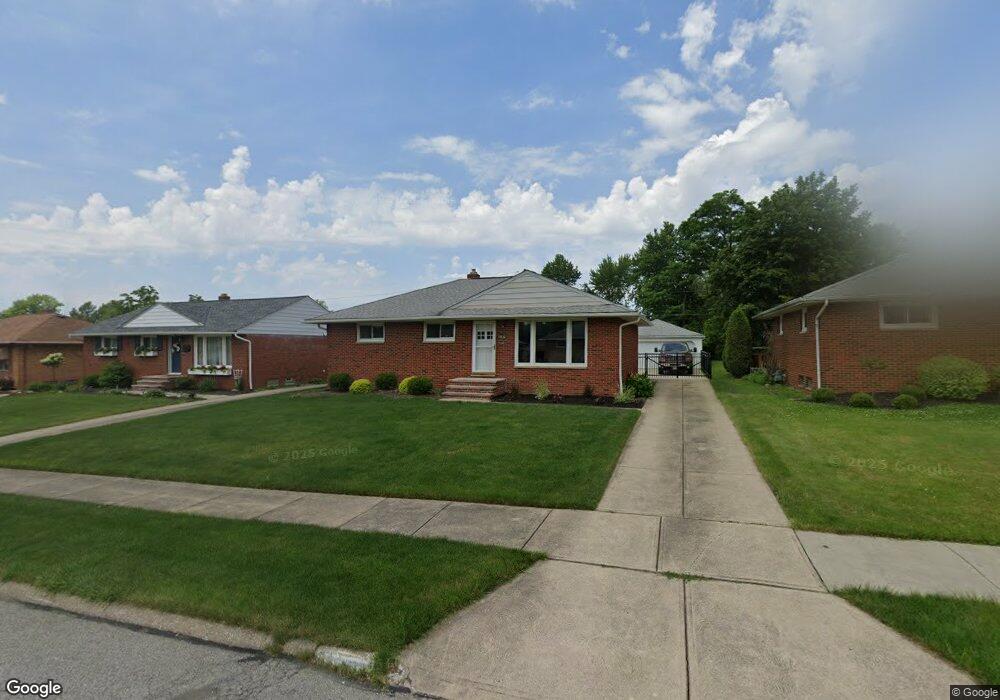
About This Home
This home is located at 10830 Schwab Dr, Parma, OH 44130 and is currently estimated at $245,046, approximately $161 per square foot. 10830 Schwab Dr is a home located in Cuyahoga County with nearby schools including Pleasant Valley Elementary School, Greenbriar Middle School, and Valley Forge High School.
Ownership History
Date
Name
Owned For
Owner Type
Purchase Details
Closed on
Apr 28, 2018
Sold by
Store Michael
Bought by
Store Michael and Store Megan M
Current Estimated Value
Purchase Details
Closed on
Dec 27, 2011
Sold by
Dolores A Ralph Irrevocable Trust and Ralph Darrel J
Bought by
Store Michael
Home Financials for this Owner
Home Financials are based on the most recent Mortgage that was taken out on this home.
Original Mortgage
$72,000
Outstanding Balance
$48,301
Interest Rate
3.99%
Mortgage Type
New Conventional
Estimated Equity
$196,745
Purchase Details
Closed on
Jun 9, 2011
Sold by
Ralph Dolores A
Bought by
The Dolores A Ralph Irrevocable Trust and Ralph Darrel J
Purchase Details
Closed on
Jun 22, 1981
Sold by
Ralph Joseph F and Ralph Dolores
Bought by
Ralph Joseph F
Purchase Details
Closed on
Jan 1, 1975
Bought by
Ralph Joseph F and Ralph Dolores
Create a Home Valuation Report for This Property
The Home Valuation Report is an in-depth analysis detailing your home's value as well as a comparison with similar homes in the area
Home Values in the Area
Average Home Value in this Area
Purchase History
| Date | Buyer | Sale Price | Title Company |
|---|---|---|---|
| Store Michael | -- | Guardian Title | |
| Store Michael | $90,000 | First Nations Title Agency | |
| The Dolores A Ralph Irrevocable Trust | -- | None Available | |
| Ralph Joseph F | -- | -- | |
| Ralph Joseph F | -- | -- |
Source: Public Records
Mortgage History
| Date | Status | Borrower | Loan Amount |
|---|---|---|---|
| Open | Store Michael | $72,000 |
Source: Public Records
Tax History
| Year | Tax Paid | Tax Assessment Tax Assessment Total Assessment is a certain percentage of the fair market value that is determined by local assessors to be the total taxable value of land and additions on the property. | Land | Improvement |
|---|---|---|---|---|
| 2025 | $4,025 | $70,315 | $13,405 | $56,910 |
| 2024 | $4,270 | $70,315 | $13,405 | $56,910 |
| 2023 | $3,833 | $54,360 | $10,920 | $43,440 |
| 2022 | $3,799 | $54,360 | $10,920 | $43,440 |
| 2021 | $3,910 | $54,360 | $10,920 | $43,440 |
| 2020 | $3,707 | $45,680 | $9,170 | $36,510 |
| 2019 | $3,562 | $130,500 | $26,200 | $104,300 |
| 2018 | $3,668 | $45,680 | $9,170 | $36,510 |
| 2017 | $3,544 | $41,200 | $7,980 | $33,220 |
| 2016 | $3,521 | $41,200 | $7,980 | $33,220 |
| 2015 | $3,276 | $41,200 | $7,980 | $33,220 |
| 2014 | $3,276 | $40,110 | $7,980 | $32,130 |
Source: Public Records
Map
Nearby Homes
- 10860 Ronald Dr
- 11190 Ronald Dr
- 11183 Johnson Dr
- 10212 Vienna Dr
- 7181 York Rd
- 7408 Wake Robin Dr
- 7706 E Linden Ln
- 9850 Boundary Ln
- 8920 York Rd
- 7547 N Linden Ln
- 9421 Rainbow Ln
- 6849 Lantern Ln
- 8960 Wildwood Dr
- 8267 Pinehurst Dr
- 6846 Revere Rd
- 6888 Reid Dr
- 7042 Parma Park Blvd
- 8320 Craigleigh Dr
- 7209 Maplewood Rd
- 10152 Lynn Dr
- 10854 Schwab Dr
- 10804 Schwab Dr
- 10880 Schwab Dr
- 10780 Schwab Dr
- 10900 Schwab Dr
- 10750 Schwab Dr
- 10831 Schwab Dr
- 10855 Schwab Dr
- 10805 Schwab Dr
- 10881 Schwab Dr
- 10781 Schwab Dr
- 10920 Schwab Dr
- 10901 Schwab Dr
- 10751 Schwab Dr
- 10950 Schwab Dr
- 10921 Schwab Dr
- 10791 Glamer Dr
- 7568 York Rd
- 10840 Ronald Dr
- 10813 Glamer Dr
Your Personal Tour Guide
Ask me questions while you tour the home.