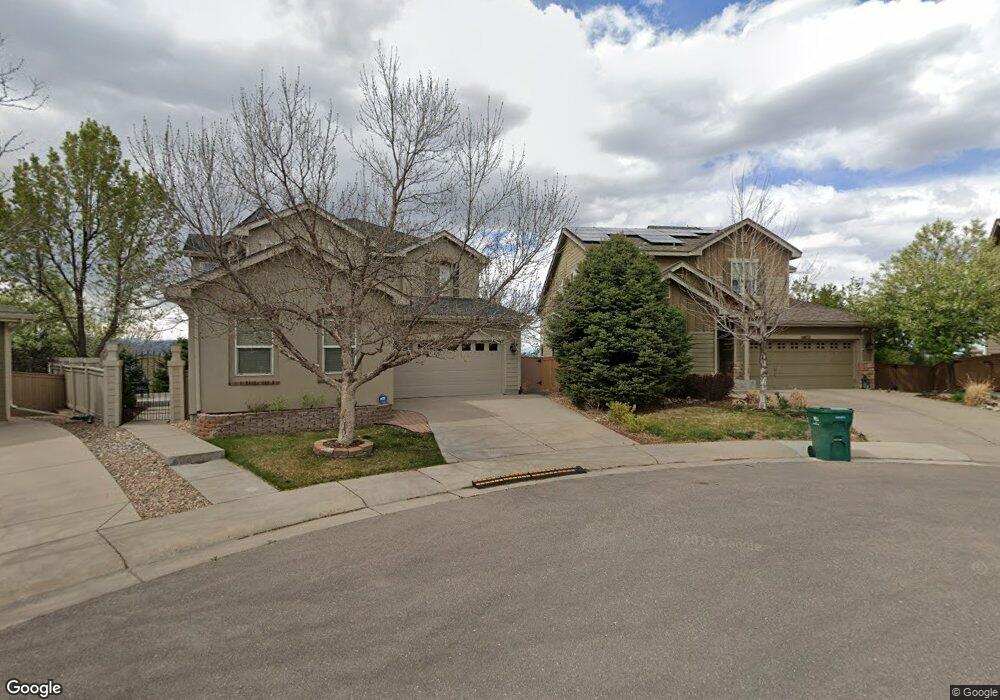
10833 Fox Sedge Way Highlands Ranch, CO 80126
Southridge NeighborhoodEstimated Value: $886,302 - $996,000
4
Beds
4
Baths
3,956
Sq Ft
$242/Sq Ft
Est. Value
About This Home
This home is located at 10833 Fox Sedge Way, Highlands Ranch, CO 80126 and is currently estimated at $956,326, approximately $241 per square foot. 10833 Fox Sedge Way is a home located in Douglas County with nearby schools including Copper Mesa Elementary School, Mountain Ridge Middle School, and Mountain Vista High School.
Ownership History
Date
Name
Owned For
Owner Type
Purchase Details
Closed on
Oct 11, 2013
Sold by
Becher Megan M and Harris Jason D
Bought by
Cadol Elizabeth A and Bartlett Christina K
Current Estimated Value
Home Financials for this Owner
Home Financials are based on the most recent Mortgage that was taken out on this home.
Original Mortgage
$417,000
Outstanding Balance
$313,830
Interest Rate
4.54%
Mortgage Type
New Conventional
Estimated Equity
$642,496
Purchase Details
Closed on
Mar 16, 2004
Sold by
Shea Homes Lp
Bought by
Harris Jason D and Becher Megan M
Home Financials for this Owner
Home Financials are based on the most recent Mortgage that was taken out on this home.
Original Mortgage
$291,500
Interest Rate
4.37%
Mortgage Type
Unknown
Create a Home Valuation Report for This Property
The Home Valuation Report is an in-depth analysis detailing your home's value as well as a comparison with similar homes in the area
Home Values in the Area
Average Home Value in this Area
Purchase History
| Date | Buyer | Sale Price | Title Company |
|---|---|---|---|
| Cadol Elizabeth A | $536,000 | Land Title Guarantee Company | |
| Harris Jason D | $364,395 | North American Title |
Source: Public Records
Mortgage History
| Date | Status | Borrower | Loan Amount |
|---|---|---|---|
| Open | Cadol Elizabeth A | $417,000 | |
| Previous Owner | Harris Jason D | $291,500 | |
| Closed | Harris Jason D | $26,000 |
Source: Public Records
Tax History Compared to Growth
Tax History
| Year | Tax Paid | Tax Assessment Tax Assessment Total Assessment is a certain percentage of the fair market value that is determined by local assessors to be the total taxable value of land and additions on the property. | Land | Improvement |
|---|---|---|---|---|
| 2024 | $5,669 | $63,840 | $12,360 | $51,480 |
| 2023 | $5,659 | $63,840 | $12,360 | $51,480 |
| 2022 | $4,026 | $44,070 | $9,000 | $35,070 |
| 2021 | $4,188 | $44,070 | $9,000 | $35,070 |
| 2020 | $3,897 | $42,020 | $8,190 | $33,830 |
| 2019 | $3,912 | $42,020 | $8,190 | $33,830 |
| 2018 | $3,588 | $37,960 | $7,820 | $30,140 |
| 2017 | $3,267 | $37,960 | $7,820 | $30,140 |
| 2016 | $3,329 | $37,970 | $7,560 | $30,410 |
| 2015 | $3,401 | $37,970 | $7,560 | $30,410 |
| 2014 | $2,988 | $30,800 | $5,410 | $25,390 |
Source: Public Records
Map
Nearby Homes
- 10837 Fox Sedge Way
- 3047 Windridge Cir
- 3000 Fox Sedge Ln
- 2934 Braeburn Way
- 10726 Middlebury Way
- 10728 Evondale St
- 2996 Danbury Ave
- 10655 Cherrybrook Cir
- 3171 Green Haven Cir
- 10626 Cherrybrook Cir
- 10575 Pearlwood Cir
- 10704 Riverbrook Cir
- 3229 Green Haven Cir
- 10696 Riverbrook Cir
- 10254 Willowbridge Ct
- 3954 Blue Pine Cir
- 10832 Hickory Ridge Ln
- 10994 Shadowbrook Cir
- 3851 Stonebrush Dr Unit 11B
- 10588 Parkington Ln Unit 39A
- 10836 Fox Sedge Way
- 3074 Braeburn Place
- 3066 Braeburn Place
- 3082 Braeburn Place
- 10841 Fox Sedge Way
- 10840 Fox Sedge Way
- 2988 Braeburn Way
- 2994 Braeburn Way
- 3090 Braeburn Place
- 2982 Braeburn Way
- 10851 Fox Sedge Way
- 3058 Braeburn Place
- 2998 Braeburn Way
- 10846 Fox Sedge Way
- 10852 Fox Sedge Way
- 3100 Braeburn Place
- 3004 Braeburn Way
- 10824 Trotwood Way
- 3039 Fox Sedge Ln
- 3050 Braeburn Place