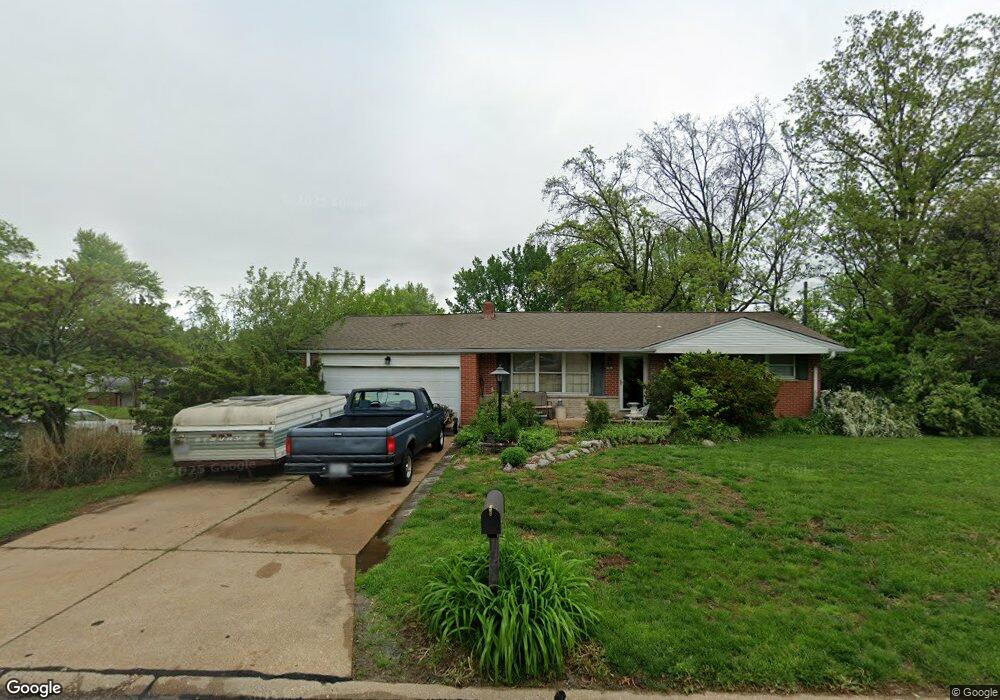
10833 Ritter Dr Saint Louis, MO 63114
Estimated Value: $205,311 - $213,000
2
Beds
2
Baths
1,026
Sq Ft
$204/Sq Ft
Est. Value
About This Home
This home is located at 10833 Ritter Dr, Saint Louis, MO 63114 and is currently estimated at $209,328, approximately $204 per square foot. 10833 Ritter Dr is a home located in St. Louis County with nearby schools including Willow Brook Elementary School, Pattonville Heights Middle School, and Pattonville High School.
Ownership History
Date
Name
Owned For
Owner Type
Purchase Details
Closed on
Jan 15, 2004
Sold by
Drake Jeffrey D and Drake Christy L
Bought by
Drake Jeffrey D and Drake Christy L
Current Estimated Value
Home Financials for this Owner
Home Financials are based on the most recent Mortgage that was taken out on this home.
Original Mortgage
$125,000
Outstanding Balance
$58,011
Interest Rate
5.79%
Mortgage Type
Stand Alone Refi Refinance Of Original Loan
Estimated Equity
$151,317
Purchase Details
Closed on
Jun 26, 2001
Sold by
Langdon Damon L and Langdon Lori M Judge
Bought by
Drake Jeffery D and Frisch Christy L
Home Financials for this Owner
Home Financials are based on the most recent Mortgage that was taken out on this home.
Original Mortgage
$110,761
Interest Rate
7.16%
Mortgage Type
FHA
Purchase Details
Closed on
May 2, 1997
Sold by
Hayes Betty C
Bought by
Langdon Damon L and Judge Langdon Lori M
Home Financials for this Owner
Home Financials are based on the most recent Mortgage that was taken out on this home.
Original Mortgage
$58,900
Interest Rate
7.97%
Create a Home Valuation Report for This Property
The Home Valuation Report is an in-depth analysis detailing your home's value as well as a comparison with similar homes in the area
Home Values in the Area
Average Home Value in this Area
Purchase History
| Date | Buyer | Sale Price | Title Company |
|---|---|---|---|
| Drake Jeffrey D | -- | Archway Title Agency Inc | |
| Drake Jeffery D | $112,500 | -- | |
| Langdon Damon L | -- | -- |
Source: Public Records
Mortgage History
| Date | Status | Borrower | Loan Amount |
|---|---|---|---|
| Open | Drake Jeffrey D | $125,000 | |
| Closed | Drake Jeffery D | $110,761 | |
| Previous Owner | Langdon Damon L | $58,900 |
Source: Public Records
Tax History Compared to Growth
Tax History
| Year | Tax Paid | Tax Assessment Tax Assessment Total Assessment is a certain percentage of the fair market value that is determined by local assessors to be the total taxable value of land and additions on the property. | Land | Improvement |
|---|---|---|---|---|
| 2025 | $2,525 | $39,270 | $7,050 | $32,220 |
| 2024 | $2,525 | $32,810 | $7,920 | $24,890 |
| 2023 | $2,525 | $32,810 | $7,920 | $24,890 |
| 2022 | $2,419 | $28,330 | $10,580 | $17,750 |
| 2021 | $2,409 | $28,330 | $10,580 | $17,750 |
| 2020 | $2,261 | $25,520 | $8,820 | $16,700 |
| 2019 | $2,250 | $25,520 | $8,820 | $16,700 |
| 2018 | $1,974 | $20,270 | $3,340 | $16,930 |
| 2017 | $1,974 | $20,270 | $3,340 | $16,930 |
| 2016 | $1,820 | $18,600 | $4,670 | $13,930 |
| 2015 | $1,800 | $18,600 | $4,670 | $13,930 |
| 2014 | $2,034 | $20,960 | $5,090 | $15,870 |
Source: Public Records
Map
Nearby Homes
- 2300 Ruckert Ave
- 2255 N Warson Rd
- 10726 Niblic Dr
- 10627 Canter Way
- 2430 Prouhet Ave
- 2454 Prouhet Ave
- 2450 Fowler Ave
- 2412 Silkwood Dr
- 1841 N Warson Rd
- 2729 Link Rd
- 10719 Thorpe Ave
- 10490 Canter Way
- 10651 Thorpe Ave
- 10730 Wurdack Ave
- 2703 Ashby Rd
- 10310 Lackland Rd
- 10301 Niblic Dr
- 10235 Midland Blvd
- 10515 Clarendon Ave
- 3001 Ashby Rd
- 2328 Bruno Ave
- 2319 Waukon Dr
- 2327 Waukon Dr
- 10836 Ritter Dr
- 2334 Bruno Ave
- 10830 Ritter Dr
- 2333 Waukon Dr
- 2315 Bruno Ave
- 2325 Bruno Ave
- 2321 Bruno Ave
- 2309 Waukon Dr
- 2331 Bruno Ave
- 2338 Bruno Ave
- 2339 Waukon Dr
- 2337 Bruno Ave
- 2320 Waukon Dr
- 10811 N Warson Rd
- 10809 N Warson Rd
- 10805 N Warson Rd
- 2344 Bruno Ave